
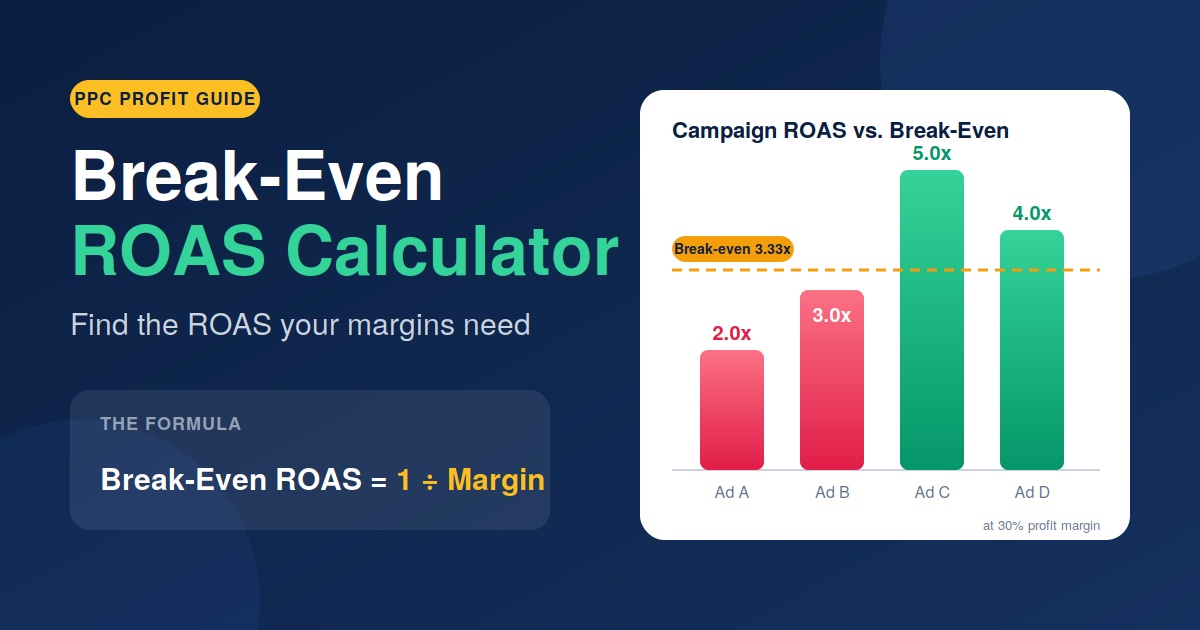
Break-even ROAS is the return on ad spend at which advertising pays for itself and nothing more: 1 divided by your contribution margin before ad spend. The calculator below builds that margin from real costs per order, then returns your break-even ROAS, the target ROAS for the profit you want, and where your current ROAS stands.
Interactive calculator Inputs: average order value, product cost %, shipping and fulfilment per order, returns and refunds lost %, other costs per order, payment processor (Shopify Payments Basic, Grow, Advanced, Plus; Stripe; PayPal Checkout; custom), target profit %, first-order discount %, ad spend and store revenue for a period. Outputs: contribution per order, contribution margin, break-even ROAS, break-even cost per order, target ROAS, first-order break-even ROAS, your ROAS, profit after ad spend, and a one-line verdict. Defaults: a $100 apparel order giving a 2.28 break-even ROAS.
How the break-even ROAS calculator works
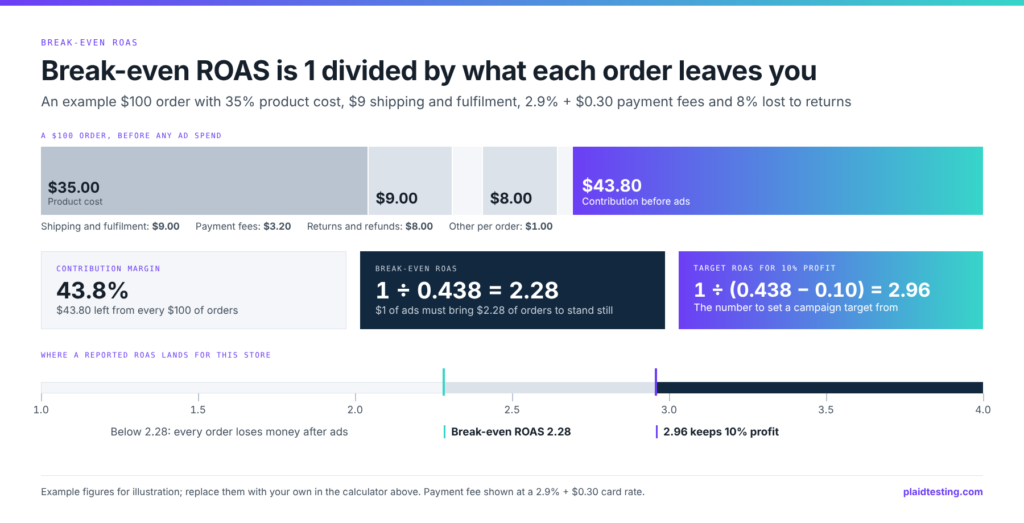
Most break-even calculators ask for one number, your profit margin, and divide 1 by it. The arithmetic is right; the input is usually wrong, because the margin people type in is gross margin, measured before the costs that come with every order. This calculator builds contribution margin from its parts instead. Start with average order value, take away product cost, shipping and fulfilment, payment processing, the share of revenue lost to returns and any other cost that rises with each order. What is left, divided by order value, is contribution margin before ad spend.
From there every output is one step away. Break-even ROAS is 1 divided by contribution margin. Break-even cost per order is the contribution itself: the most you can spend on ads to win one order without losing money. Target ROAS adds the profit you want to keep and divides 1 by contribution margin minus that profit share. The first-order figure repeats the sum with a welcome discount applied, because a new customer’s first order usually leaves less than an average order. Enter ad spend and store revenue for the same dates and the calculator compares your ROAS with break-even and shows profit after ad spend.
| Output | Formula | With the default example order |
|---|---|---|
| Contribution per order | Order value − product cost − shipping and fulfilment − payment fees − returns lost − other costs | $100 − $35 − $9 − $3.20 − $8 − $1 = $43.80 |
| Contribution margin | Contribution ÷ order value | 43.8% |
| Break-even ROAS | 1 ÷ contribution margin | 2.28 |
| Target ROAS for 10% profit | 1 ÷ (contribution margin − 0.10) | 2.96 |
| First-order break-even ROAS | The same sum on a $90 order after a 10% welcome discount | 2.58 |
| Profit after ad spend | Revenue × contribution margin − ad spend | $150,000 × 43.8% − $50,000 = $15,700 |
What costs belong in contribution margin?
Include every cost that rises with each order and leave out costs that stay the same whatever you sell. Product cost, pick and pack, postage, packaging, payment fees and the revenue lost to returns all belong in the sum. Rent, salaries, software subscriptions and agency retainers do not; they are paid from contribution, not subtracted before it. Ad spend stays out too, since break-even ROAS is the ratio it has to clear.
| Cost | Where to find it | 2026 reference point |
|---|---|---|
| Payment processing | Your payment provider’s statement | Shopify Payments US online cards: 2.9% + 30¢ on Basic, 2.7% + 30¢ on Grow, 2.5% + 30¢ on Advanced, 2.25% + 30¢ on Plus |
| Third-party gateway fee | Shopify bills, if you do not use Shopify Payments | 2% on Basic, 1% on Grow, 0.6% on Advanced, 0.2% on Plus, on top of the gateway’s own fee |
| Shipping | Carrier and 3PL invoices, divided by orders shipped | USPS Ground Advantage prices rose about 7.8% on average in January 2026; a temporary increase averaging 8.0% on USPS competitive products followed in April |
| Returns and refunds | Refunds report, net of items resold at full price | US retailers expected returns worth 15.8% of 2025 sales, 19.3% for online sales |
| Discounts | Discount report, especially welcome and first-order codes | Set by your own offer calendar |
Sources: Shopify pricing; USPS rate change, Federal Register, 19 November 2025 and 30 March 2026; NRF and Happy Returns, 15 October 2025. Stripe’s standard US online card rate is also 2.9% + 30¢ (Stripe), and PayPal Checkout charges 3.49% plus a 49¢ fixed fee (PayPal, updated 1 October 2026).
Two of those rows move during the year. Postage changed twice in 2026, so a shipping cost per order worked out last winter is already low. Returns rise after peak season, so use a full year of refunds rather than a quiet month. Enter returns as the value you actually lose, not the gross refund rate: an item that comes back unworn and sells again at full price costs you return postage and handling, not its whole price. Discounts need one decision. If your average order value is already measured after discounts, as Shopify’s net sales figures are, leave discounts out of the costs to avoid counting them twice, and use the first-order discount field only for the extra money off that new customers receive.
Break-even ROAS for three example stores
The same formula gives very different answers depending on the shape of the order. The three illustrative stores below use the calculator’s inputs with a 10% profit target. The supplement brand’s high margin and light parcels give it room that a home goods brand, with heavy shipping and a 45% product cost, does not have.
| Example store | Order value | Costs per order | Contribution margin | Break-even ROAS | Target ROAS, 10% profit |
|---|---|---|---|---|---|
| Apparel | $100 | 35% product, $9 shipping, Basic card rate, 8% returns, $1 other | 43.8% | 2.28 | 2.96 |
| Supplements | $60 | 22% product, $7 shipping, Grow card rate, 2% returns, $1 other | 59.5% | 1.68 | 2.02 |
| Home goods | $140 | 45% product, $22 shipping, Advanced card rate, 6% returns, $2 other | 29.1% | 3.43 | 5.22 |
Set against the 2026 benchmarks, the gap is plain. Triple Whale’s median Meta ROAS across more than 40,000 brands is 1.88, and its all-category Google figure is 3.27 (Triple Whale, 17 August 2026; Triple Whale, 20 August 2026). A ROAS of 1.88 is profitable for the supplement store and loses money for the other two, and 3.27 still leaves the home goods store short of break-even. A benchmark says what is typical, never what is enough.
A note on the target formula. Some calculators define the target as profit per dollar of ad spend rather than profit as a share of revenue, which gives a different number for the same inputs. This calculator uses profit as a share of revenue, the way most finance teams state a margin goal, so the target ROAS can be checked straight against the P&L.
If your ROAS sits close to break-even and you are not sure which costs to trust, our paid media management starts from this calculation and sets every channel’s target from it.
Why does break-even ROAS differ for new customers?
A first order rarely looks like an average order. It often carries a welcome discount, it may ship free under a threshold that repeat buyers clear easily, and a first order can be returned more often, because the buyer has not tried the fit or the product before. Each of those lowers first-order contribution and raises the ROAS that new customer revenue has to reach. In the default example, a 10% welcome discount alone lifts break-even from 2.28 to 2.58.
That matters because the ROAS most brands should manage to is new customer ROAS: revenue from first-time customers divided by ad spend. Compare NC-ROAS with first-order break-even, and blended ROAS with ordinary break-even; mixing the two pairs makes acquisition look either cheaper or dearer than it is. Our guide to NC-ROAS and how to set a new customer floor adds repeat purchases to the picture.
Basket size moves break-even too, through costs that are fixed per order. At an athletic apparel brand we work with, June 2026 orders carried about 2.2 units each, up from about 1.9 in June 2025: 65,039 units on roughly 29,200 orders against 45,365 units on roughly 24,000, with order counts estimated from sales and average order value in its Triple Whale account. More units in each box spread the same pick, pack and postage over more revenue, which raises contribution margin per order and lowers break-even ROAS without any change to the ads. The figures are store-wide rather than tied to any channel, and product and merchandising decisions drove them.
What should you do when ROAS is below break-even?
Check the measurement before changing the ads. A platform’s reported ROAS can sit below break-even while blended store results are fine, or the reverse, so compare store revenue against total ad spend for the same dates first. If blended ROAS is genuinely below break-even, there are two sides to work on, and the calculator shows which moves the number most for your store.
On the cost side, raise contribution per order. Bundles and free shipping thresholds lift order value against costs that are fixed per order. Renegotiating 3PL rates, moving to a cheaper payment plan and cutting returns with better size guidance all lower costs per order. Each point of contribution margin you gain lowers break-even ROAS for every channel at once.
On the spend side, find where the money stops returning. Usually the losing dollars are the last ones: an account’s average ROAS sits near break-even because its most recent budget increases returned far less. Our guide to marginal ROAS shows how to find that point with a budget step test. Then set platform targets with headroom above break-even, since Google’s Target ROAS bidding aims at an average and accepts some conversions below it. Google’s own retail guidance is to set a ROAS target based on what will yield the highest profit (Google Ads Help), and break-even is where that calculation starts.
Want the calculation run on your real costs? Book a free 30 minute growth audit and we will build your contribution margin, break-even and target ROAS from your Shopify and shipping data, and show which channels clear it.
Common questions
What is a break-even ROAS?
Break-even ROAS is the return on ad spend at which the contribution from ad-driven orders exactly covers the ad spend, so the ads neither make nor lose money. It equals 1 divided by contribution margin before ad spend. A store keeping 40% of each order after product, shipping, fees and returns breaks even at a ROAS of 2.5.
How do you calculate break-even ROAS?
Subtract product cost, shipping and fulfilment, payment fees, returns lost and other per-order costs from average order value. Divide what is left by order value to get contribution margin, then divide 1 by that margin. For a $100 order leaving $43.80, contribution margin is 43.8% and break-even ROAS is 1 divided by 0.438, which is 2.28.
What ROAS is a 25% ACoS?
A 25% ACoS equals a ROAS of 4.0. ACoS, advertising cost of sales, is ad spend divided by ad revenue, so ROAS is its inverse: 1 divided by 0.25. Amazon advises keeping ACoS below profit margin, which is the same test as keeping ROAS above break-even ROAS.
Is a ROAS of 4 good?
A ROAS of 4 is profitable for any store with a contribution margin above 25%, since 4.0 is the break-even point at exactly 25%. For a store keeping 45% of each order it is very strong; for one keeping 20% it still loses money. Calculate your break-even before judging any ROAS figure.