
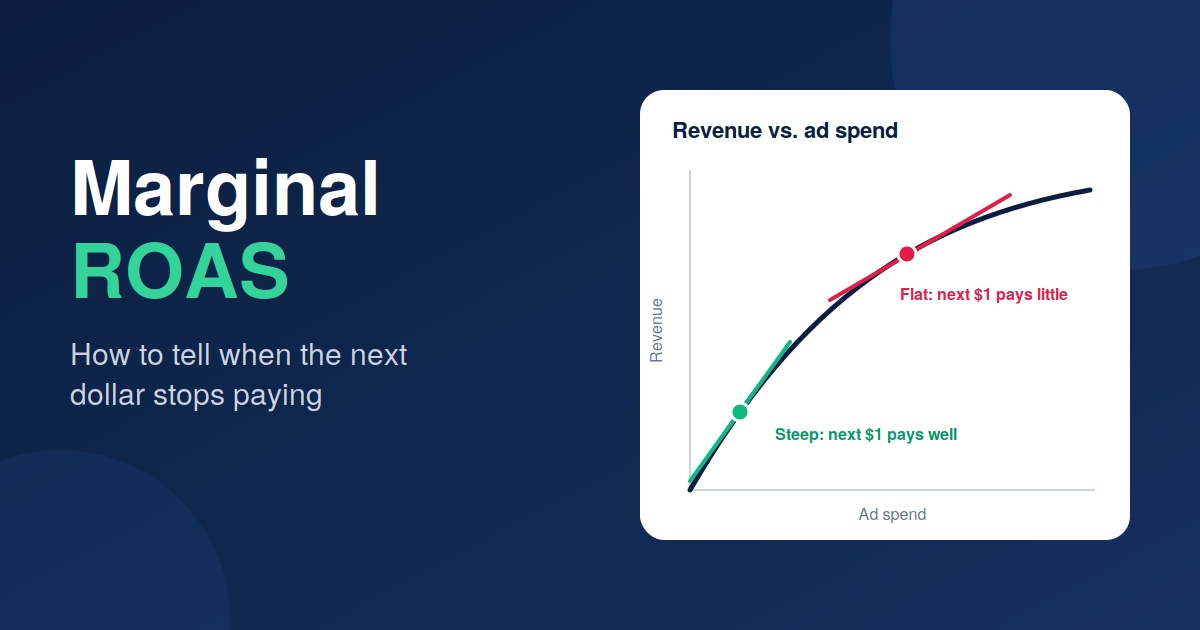
Marginal ROAS is the revenue the next dollar of ad spend brings in: the change in revenue divided by the change in spend between two budget levels. Average ROAS says what the whole budget returned. Scaling decisions need the marginal figure, because it usually falls as spend rises and can sink below break-even while the average still looks healthy.
The distinction matters more in 2026 because each step of extra budget buys less than it did. Meta’s average price per ad rose 12% year over year in the second quarter (Meta, 29 July 2026), and Triple Whale’s median Meta CPM across more than 40,000 brands reached $15.06, up 13.24% (Triple Whale, 17 August 2026). A brand that scales on its average ROAS alone is pricing the next dollar off the first one.
What is marginal ROAS, and how is it different from average ROAS?
Average ROAS divides all the revenue a budget produced by all of that budget. Marginal ROAS looks only at the edge: if spend rises from one level to the next, how much extra revenue did the extra spend bring? Between two budget levels the formula is (revenue at the new spend minus revenue at the old spend) divided by (new spend minus old spend). Measured in very small steps, it becomes the slope of the curve that links spend to revenue.
Google’s open-source media mix model, Meridian, describes its marginal measure, mROI, as the return on “the next dollar” above historical spend, and defines it as the derivative of the response curve (Google Meridian, updated 15 May 2026). Its worked example makes the gap concrete: a channel that returned $25,000 of incremental revenue on $10,000 has an ROI of $2.50, yet the next dollar into a saturating channel “might be only $0.80”. Meta’s open-source model, Robyn, calls the same quantity the marginal response, the next dollar response, and treats it as the key metric for budget allocation (Robyn documentation).
The practical consequence is simple. Two campaigns with the same average ROAS of 3.0 can deserve opposite decisions. One may still return 2.8 on its next dollar and be worth scaling; the other may return 1.2 on its next dollar and be worth trimming. Average ROAS cannot tell them apart.
Is marginal ROAS the same as incremental ROAS?
No, though some vendors use the terms interchangeably. Incremental ROAS, or iROAS, is revenue that would not have happened without the ads, divided by spend, usually measured by comparing exposed regions or users with a holdout (Haus glossary). It is an average: the causal return of the whole budget being tested. Marginal ROAS is about the next dollar. The two answer different questions, and the strongest reading combines them: the incremental return of the next dollar, measured by a test that raises or lowers spend rather than switching it off.
| Measure | Question it answers | How it is usually measured | Main weakness |
|---|---|---|---|
| Platform ROAS | What did the platform credit to the whole budget? | The ad platform’s attribution | Counts sales that would have happened anyway, or misses some it caused |
| Marginal ROAS (attributed) | What did the last step of budget add in reported or store revenue? | Budget step tests, read on store revenue | Seasonality and other changes can move revenue during the test |
| Incremental ROAS | What did the whole budget cause? | Geo or audience holdout | An average, so it can hide a weak last dollar |
| Marginal incremental ROAS | What did the next dollar cause? | Spend-increase or spend-decrease holdout tests, or a calibrated media mix model | Needs more budget, time and statistical care |
The gap between attributed and incremental numbers runs in both directions. Across 640 Haus experiments on Meta, the platform’s 7-day click reporting under-counted measured incrementality by 15% on average for brands selling only through their own site (Haus, 28 July 2025). That finding describes the average return of whole budgets; the next dollar can sit further from either number. For most brands spending $50K to $500K a month, the attributed marginal read from a disciplined step test is the practical starting point, read on store revenue rather than platform revenue and checked against an incrementality test once a channel carries enough budget to justify one.
Why does marginal ROAS fall as spend rises?
Both Meridian and Robyn build diminishing returns into their models: each added unit of spend raises the response at a declining rate (Google Meridian glossary). In an ad account, three forces usually produce that curve. The first is audience depth. The most likely buyers are reached first, so each extra dollar reaches people who are less likely to buy, or reaches the same people more often. The second is frequency. Showing the same ad to the same person a fifth time rarely does what the first view did. The third is price. Pushing more budget into an auction means accepting more expensive impressions, which is why rising CPMs make every step of budget dearer.
It is a tendency, not a law. A new creative concept, a better offer, a new product or a fresh audience can lift the whole curve, so marginal returns at a higher budget can beat the old average. That is the point of the step test below: it measures where your curve sits now rather than assuming its shape.
Meridian also flags a caveat worth borrowing. Its marginal estimates assume a constant cost per unit of media and grow less reliable beyond the spend levels already observed. When CPMs are climbing, last quarter’s marginal ROAS overstates what the next dollar will buy this quarter, and a budget far above anything the account has spent before is a forecast, not a measurement.
How do you measure marginal ROAS without a media mix model?
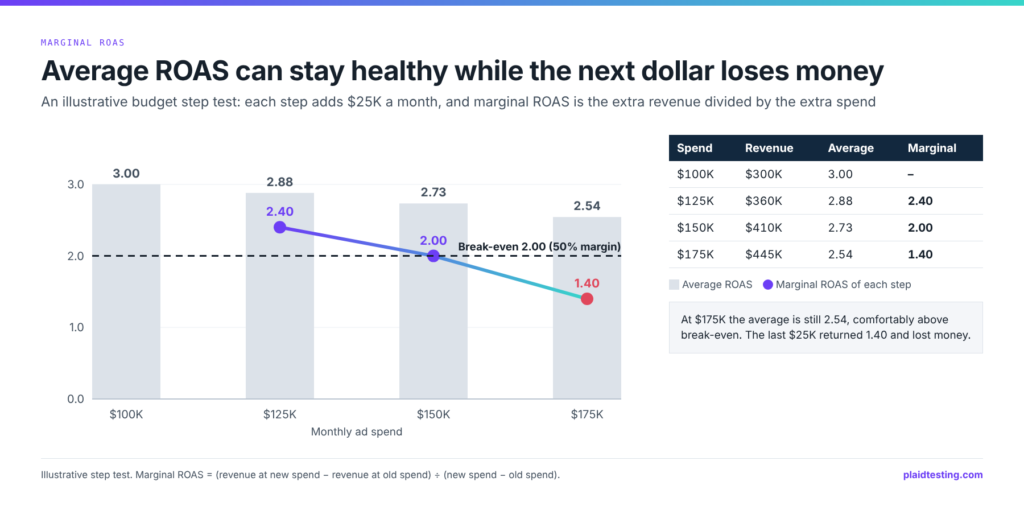
With a budget step test. Raise or lower spend on one campaign or channel in steps, hold everything else as steady as you can, and read the change in revenue at each step. The figure shows the arithmetic on an illustrative account.
In the accounts we run, a step test follows six rules:
- Change one thing. Creative, offer, targeting and bidding stay fixed while budget moves, or the test measures the wrong lever.
- Move in steps of 15% to 25%. Smaller steps disappear in daily noise; larger ones jump past the point you are trying to find.
- Give each step at least seven days, so weekdays and weekends both count and the platform’s learning settles.
- Read the result on store revenue and new customer revenue for the same dates, not only on platform ROAS.
- Run at least three spend levels, so the slope between them shows whether returns are flattening or holding.
- Avoid peak weeks, launches and sitewide sales, when demand moves for reasons the budget did not cause.
Measurement firms run a stricter version. Measured describes a three-cell scale test that uses roughly 10% to 15% of the intended investment to plot a diminishing-returns curve (Measured), and Haus runs spend-increase and spend-decrease experiments against holdout regions for the same purpose. Senior marketers already lean that way: in a Haus survey of 500 US decision makers managing paid budgets above $11 million, reported by EMARKETER, 60% named incrementality testing as the measurement they trust most, against 37% for in-platform reporting (EMARKETER, 19 May 2026). Haus sells that testing, so read the poll as direction rather than proof.
Step tests only pay off if the budget moves when the answer comes in. That weekly reallocation, across every channel on blended results, is how our paid media management runs.
What is a good marginal ROAS?
A good marginal ROAS is one at or above your break-even ROAS, which is 1 divided by contribution margin before ad spend. The profit on the marginal dollar is marginal ROAS multiplied by contribution margin, minus the dollar spent. At a 50% margin, a marginal ROAS of 2.0 adds nothing and 1.4 loses 30 cents on every extra dollar. The common rule that “below 1.0 loses money” is only true for a business with a 100% margin.
| Contribution margin | Break-even marginal ROAS | Profit per extra $1 at marginal ROAS 2.0 | Profit per extra $1 at marginal ROAS 3.0 |
|---|---|---|---|
| 30% | 3.33 | -$0.40 | -$0.10 |
| 40% | 2.50 | -$0.20 | $0.20 |
| 50% | 2.00 | $0.00 | $0.50 |
| 60% | 1.67 | $0.20 | $0.80 |
The decision rule follows from the table: keep adding budget while marginal ROAS is above break-even, and stop at the point where the last step returned roughly break-even. In the illustrative step test above, a brand with a 50% margin should settle between $125K and $150K a month. The move from $125K to $150K returned 2.00 on average, which adds no profit and means the last dollars of that step were already below break-even, and the move to $175K returned 1.40, which loses 30 cents on every extra dollar, even though the average at $175K is still 2.54. Meridian’s budget optimizer offers the same logic as a scenario, spending until each channel’s marginal return reaches a target you set (Google Meridian). If the brand accepts a loss on first orders because repeat purchases follow, set the bar on new customer revenue and payback instead, as our guide to NC-ROAS explains. Work out the break-even figure itself with the break-even ROAS calculator.
What does marginal ROAS look like in a real account?
At a heritage fashion brand we work with, blended ad spend rose from $368,198 in the first quarter of 2025 to $1,912,212 in the first quarter of 2026, and sales rose from $1,053,536 to $7,199,241, per its Triple Whale account. The extra $1,544,014 of spend came with $6,145,705 of extra sales: about 3.98 per extra dollar, against an average of 3.76 for the 2026 quarter. On revenue from first-time customers alone, the extra spend returned about 3.36 per dollar.
That reading needs care, and it shows why a year-over-year comparison is not a step test. The figures are blended across every paid channel, no incrementality test isolated what the ads caused, and product, merchandising and creative changes moved sales alongside media. Above all, the 2026 quarter ran on a different curve from the 2025 quarter. When creative, offer and product improve, the whole curve rises, and the marginal return can exceed the old average, as it did here. What the comparison cannot say is what the next dollar on top of $1.9 million will return. Only a step test on the current curve answers that.
That is the habit worth keeping: treat any marginal ROAS as true for the curve it was measured on, and re-measure after a major creative, offer or product change rather than carrying the old number forward.
How do Google and Meta bidding handle marginal returns?
Bidding targets work on averages. Google’s Target ROAS strategy tries to reach an average ROAS equal to the target, and Google notes that a target set too high may limit traffic (Google Ads Help). An average target of 3.0 therefore accepts some conversions well below 3.0 as long as others sit above it. If your break-even is 2.5, a 3.0 average can still include a tail of auctions that lose money at the margin, which is why we set targets with headroom above break-even rather than at it.
Meta’s delivery behaves the same way in our accounts: under its default lowest-cost bidding, the cheapest results are found first, so the most expensive ones arrive as budget grows. In both platforms, a higher budget at an unchanged target is a request to buy the more expensive conversions, and the step test is how you price them before committing. Seasonal budgets need the same care; our Black Friday budget pacing guide shows how we step Meta budgets into peak weeks rather than doubling them overnight.
Not sure whether your last budget increase paid for itself? Book a free 30 minute growth audit and we will read your recent spend changes against store revenue and new customers, and design the step test that answers it.
Common questions
What is a good marginal ROAS?
Any marginal ROAS at or above your break-even ROAS, which is 1 divided by contribution margin before ad spend. At a 40% margin that is 2.5, at 50% it is 2.0. Above break-even, each extra dollar adds profit; below it, each extra dollar loses money even if the average ROAS of the whole budget still looks comfortable.
What is the difference between marginal ROAS and incremental ROAS?
Incremental ROAS measures the revenue the ads caused, divided by the whole budget, usually through a holdout test. Marginal ROAS measures what the next dollar returns. One is an average of causal returns, the other is the return at the edge. The most useful figure combines them: the incremental return of an extra step of budget, measured with a spend-increase test.
What does it mean when marginal ROAS is below 1?
The last step of spend brought in less revenue than it cost, so it lost money before any product or shipping costs were counted. Most brands lose money well before that point, because their break-even marginal ROAS sits between 1.7 and 4.0 depending on margin. Pull budget back to the last level that returned at least break-even.
How do you know if an ad channel is saturated?
Raise spend in steps of 15% to 25% and watch the extra revenue each step brings. If each step returns noticeably less than the one before, and frequency and CPMs climb while new customer revenue stays flat, the channel is saturating at its current creative and audiences. New creative concepts or audiences can lift the curve again.
Related reading
- What Is a Good ROAS? 2026 Benchmarks and the Break-Even Test for Ecommerce: setting ROAS targets from margin rather than benchmarks
- Break-Even ROAS Calculator: Find the ROAS Your Margins Need: the break-even line every marginal reading is compared with
- NC-ROAS: How to Calculate New Customer ROAS and Set a Floor: reading spend increases on first-time customers
- Meta Ads for Black Friday: Structure and Budget Pacing: stepping budgets into peak season
- Ecommerce Attribution: Models, Tools and What to Trust: where step tests sit beside holdouts and media mix models