
Ecommerce attribution is how a brand decides which ads, emails and searches get credit for a sale. In 2026 no single report gets that fully right. Anchor on blended ROAS from your own store revenue, use platform and tool numbers to steer inside each channel, and settle disputes between them with incrementality tests.
If you spend $50,000 or more a month on ads, you have probably seen the symptom. Meta reports one revenue figure, Google Ads another, GA4 a third, and the order total in your store matches none of them. That gap is normal and mostly structural. It also shifted a great deal between 2023 and 2026, as Google, Chrome and Meta each changed what gets measured and how, while Apple’s tracking rule stayed in place.
What is ecommerce attribution, and why do the numbers disagree?
Attribution is a set of rules for handing out credit. A shopper watches a Meta video on Monday, clicks a Google Shopping ad on Wednesday, opens an email on Friday and then buys. Every system that saw part of that path applies its own rule about who earned the order. Ecommerce attribution models run from simple rules, such as last click, which gives everything to the final touch, to data-driven models that estimate credit from patterns across many paths.
The numbers disagree for four structural reasons, and none of them is a bug:
- Each platform grades its own work. Meta counts the conversions it can connect to Meta ads inside its window, and Google Ads does the same for Google. Neither subtracts what the other claimed, so one order can appear in both, and the platform totals added together can exceed what the store took in.
- Windows differ. A 7-day click window and a session-based last-click report measure different things, even when they look at the same order.
- Visibility differs. Ad platforms see impressions and clicks on their own properties. GA4 and the store only see what arrives on the site. Consent choices and app privacy settings remove different people from each view.
- Timing differs. Some ad platforms book a conversion to the day of the ad interaction while the store books it to the day of the order, so daily numbers drift even when monthly totals agree.
The order record in Shopify, or whichever platform runs your store, is the one figure in this picture that is not a model. It says a sale happened, for how much, and whether the buyer was new. It cannot say why. Hold onto that split: store data is the record of what happened, and every attribution method is an estimate of why it happened. When people search for Shopify attribution, the real question is usually how to reconcile those two views. Our tracking and attribution work starts with that reconciliation before anyone picks a tool.
What changed between 2023 and 2026?
Three sets of changes reshaped ecommerce reporting over those years, and one rule stayed put. Google removed options, Chrome reversed a change the industry had planned for, and Meta changed what its windows count, while Apple’s rule held.
Google narrowed the model menu. GA4 offers data-driven attribution, paid and organic last click, and Google paid channels last click; first click, linear, time decay and position-based models are no longer available as of November 2023 (Google Analytics Help). Google Ads no longer supports those four models either, and conversion actions that used them were upgraded to data-driven attribution (Google Ads Help). Data-driven is the default for most conversion actions. Google’s suggested volume for it is 200 or more conversions and 2,000 or more ad interactions in supported networks over 30 days, which the help page presents as a recommendation, not a hard minimum (Google Ads Help). A 2022 report built on linear or position-based credit cannot be rebuilt the same way in 2026.
Chrome kept third-party cookies. On 22 July 2024 Google said that instead of deprecating them, Chrome would let people make an informed choice (Google Privacy Sandbox, 22 July 2024). On 22 April 2025 it said Chrome would not roll out a new standalone prompt for them (Google Privacy Sandbox, 22 April 2025). Then on 17 October 2025 Google retired most Privacy Sandbox technologies, including the Attribution Reporting API and Topics, citing low adoption (Google Privacy Sandbox, 17 October 2025). The cookie deadline never arrived, and most of the replacement tools built for it are gone.
Apple’s rule held. From iOS 14.5, apps need permission through App Tracking Transparency to track users or access the advertising identifier (Apple Developer). AppsFlyer reported on 24 April 2025 that 50% of users globally consent to tracking (AppsFlyer, 24 April 2025), which still leaves about half of users outside that kind of tracking.
Meta cut and renamed windows. Meta told developers on 16 October 2025 that from 12 January 2026 its Ads Insights API would stop returning 7-day view and 28-day view attribution windows, while 1-day click, 7-day click, 28-day click, 1-day engaged view and 1-day view remain (Meta for Developers, 16 October 2025). In March 2026 Meta changed click-through attribution so that engage-through replaced engaged-view, with a default setting of 7-day click-through, 1-day engage-through and 1-day view-through, according to the trade publisher Jon Loomer Digital (10 March 2026).
| Change | Date | What it means for your reporting |
|---|---|---|
| App Tracking Transparency: apps need permission to track users or read the advertising identifier | From iOS 14.5, still in force | App-based tracking stays partial, because users who decline cannot be tracked across apps |
| GA4 drops first click, linear, time decay and position-based models | November 2023 | Only data-driven and last-click options remain; older rule-based reports cannot be reproduced |
| Google Ads stops supporting the same four models and upgrades affected conversion actions to data-driven | No date given on the help page | Check which model each conversion action uses before comparing periods |
| Chrome keeps third-party cookies and moves toward user choice | 22 July 2024 | The planned cookie cutoff did not happen in Chrome |
| Chrome drops plans for a standalone third-party cookie prompt | 22 April 2025 | No new Chrome consent step to plan around |
| Google retires most Privacy Sandbox technologies, including the Attribution Reporting API and Topics | 17 October 2025 | Do not build measurement on those APIs |
| Meta’s Ads Insights API stops returning 7-day view and 28-day view windows | 12 January 2026 | Dashboards that pulled those windows lost them; restate history on a window that survived |
| Meta replaces engaged-view with engage-through; default becomes 7-day click-through, 1-day engage-through, 1-day view-through | March 2026 | Click-based results before and after March 2026 are not like for like |
The practical consequence: a year-over-year comparison of platform-reported results is unsafe until you confirm that the model and the window were the same in both periods. Store revenue, ad spend and order counts did not change definition at all, which is one more reason to anchor on them.
Which measurement methods should you compare?
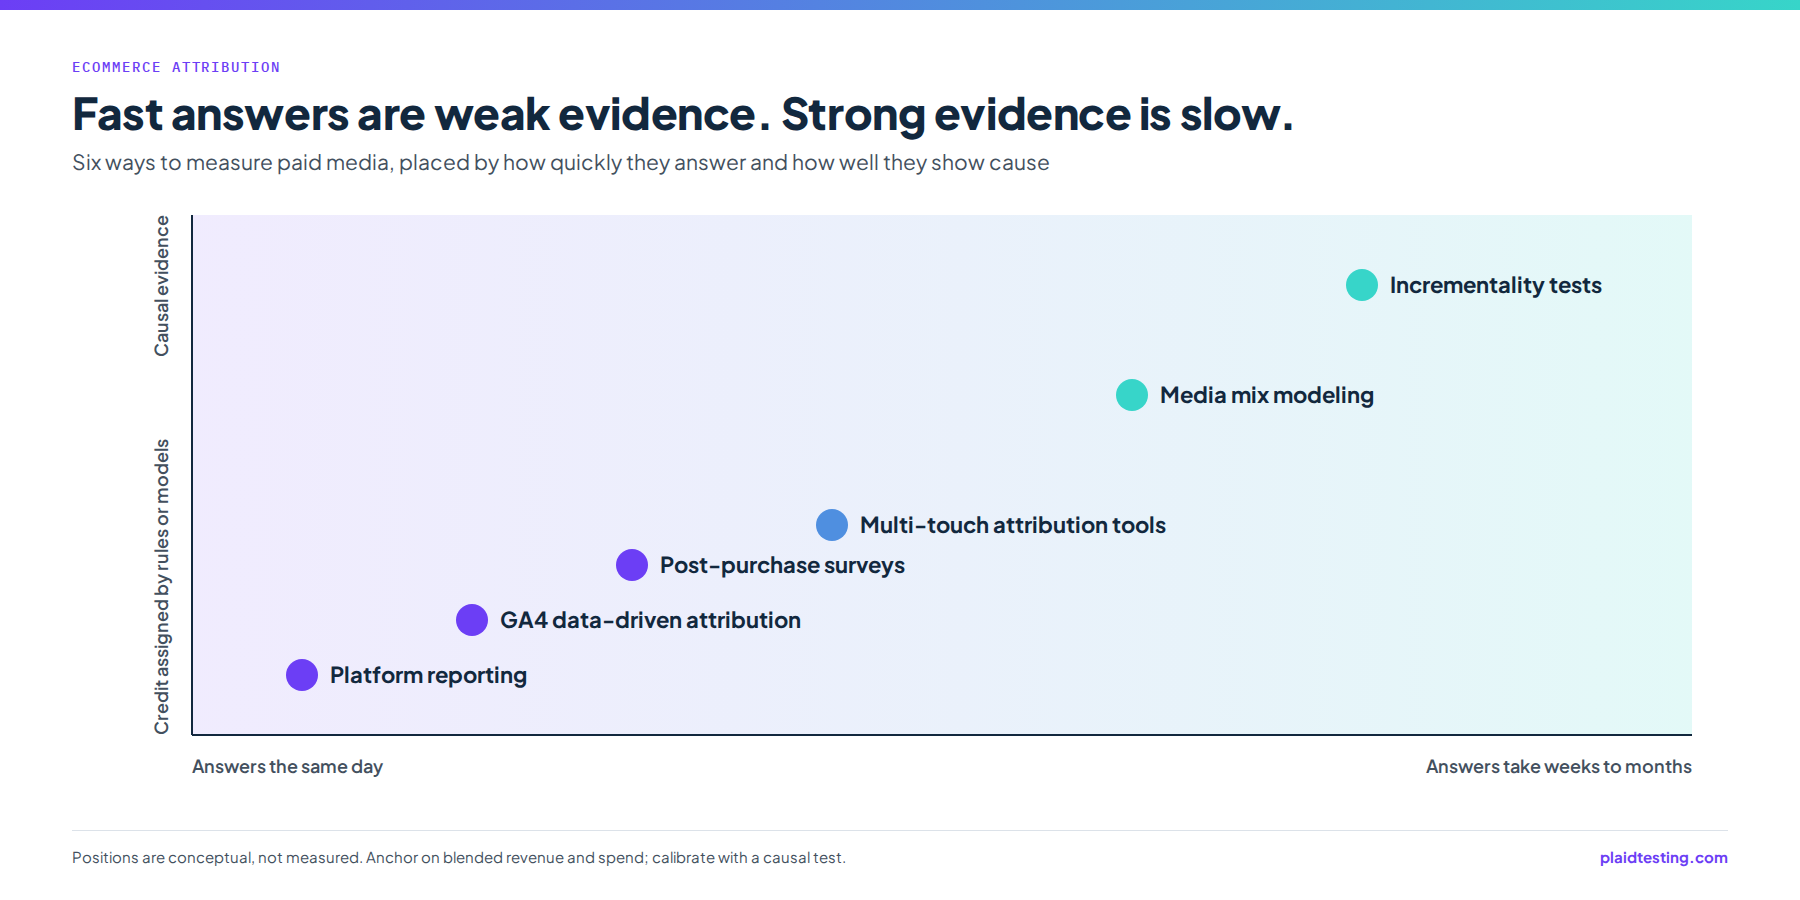
Six methods are worth knowing, and they are not rivals. Each answers a different question at a different speed with a different blind spot. The most expensive mistake we see is asking one method a question it was never built to answer, such as asking Meta’s own reporting whether Meta deserves more budget than Google.
| Method | Question it answers | Speed | Blind spot | Published price examples |
|---|---|---|---|---|
| Platform reporting (Meta, Google Ads) | Which campaigns, ad sets and ads the platform credits inside its own window | Same day | Grades itself; cannot see other platforms’ touches or sales off your site; Meta windows changed in 2026 | Included with the ad account |
| GA4 data-driven attribution | How credit splits across the channels that sent tracked sessions | Daily | Sees only sessions it can identify; no view of ad impressions on other platforms | Included with GA4 |
| Multi-touch attribution tools | How channels and campaigns compare on one scale, using the tool’s own tracking and store orders | Daily | Still a model: view credit and cross-device matching are estimates, and it cannot prove cause | Triple Whale Foundation from $219 a month, Automate from $749; Polar Analytics Core $750 a month; Northbeam Professional $3,500 a month |
| Post-purchase surveys | Where buyers say they first heard about you | Daily once live | Memory is unreliable, the answer list shapes the answers, and only buyers respond | Fairing free up to 200 transactions, Core $49 a month; KnoCommerce $19, $119 and $299 a month |
| Media mix modeling | How revenue responds to spend by channel over time, including effects no pixel sees | Slow: needs months of history | Needs a long, varied spend history; weak at campaign level | No published price in our sources |
| Incrementality tests (geo or holdout) | Which sales would not have happened without a channel or campaign | Weeks per test | Answers one question for one period; held-out regions or audiences give up some sales | No published price in our sources |
Buy-side marketers already mix methods, and many are not satisfied with the result. In the IAB’s State of Data 2026 report, 76% of more than 400 US buy-side decision makers used incrementality tests, 73% used attribution analysis and 67% used marketing mix models, but only 39% used all three, and 60% to 75% said advanced measurement underperformed on rigor, coverage, timeliness, trust or efficiency (IAB, 2 February 2026). A Haus survey of 500 US senior decision makers, reported by EMARKETER on 19 May 2026, found that 60% trusted independent incrementality testing most, against 40% for media mix modeling and 37% for in-platform reporting, and that 78% believed at least 10% of marketing spend is wasted because of insufficient measurement.
Both surveys describe senior buy-side decision makers in general rather than ecommerce brands at $50,000 a month, and Haus sells incrementality testing, so weigh the second one with that in mind. The useful signal is the pattern: people trust methods that test cause more than methods that assign credit, and few run the full set.
For a brand at this size, three layers are usually enough to start: store data for what happened, platform reporting plus one multi-touch or survey view for daily steering, and an incrementality test when a budget decision is large enough to deserve one. Media mix modeling needs a long and varied spend history before it says anything useful, so we rarely begin there.
When Meta, Google and your store tell three different stories, a free 30 minute growth audit is a quick way to learn which gaps are structural and which come from broken tracking.
Which attribution tools fit which stage?
Attribution tools for ecommerce fall into two groups: multi-touch platforms that model credit across channels, and post-purchase surveys that ask buyers directly. Published prices give a rough map, with one caveat. Several vendors price on revenue or data volume, so the figure you are quoted can differ from the list.
Triple Whale prices on annual GMV plus the package you choose, Foundation, Automate or Enterprise, and it offers a free plan (Triple Whale pricing). Its Shopify App Store listing shows Foundation from $219 a month and Automate from $749 a month, without stating the GMV level those prices apply to (Shopify App Store). Northbeam lists a Starter plan at $1,500 and a Professional plan at $3,500 a month for brands spending up to $500,000 a month on ads, priced by data volume measured in pageviews (Northbeam pricing). Polar Analytics lists Core at $750 a month, priced on online GMV (Shopify App Store).
Surveys cost far less. Fairing is free up to 200 transactions, and its Core plan is $49 a month for 201 to 500 transactions (Fairing pricing). KnoCommerce publishes plans at $19, $119 and $299 a month, and recommends its $119 Analyst plan for brands spending under $100,000 a month on ads, with its Pro plan above that level (KnoCommerce pricing).
Set against media, the share depends heavily on scale. Northbeam lists its Professional plan for brands spending up to $500,000 a month, where it equals 0.7% of media ($3,500 divided by $500,000); a brand spending $50,000 a month on the same plan would pay 7% ($3,500 divided by $50,000). Triple Whale’s Automate listing starts at about 1.5% of a $50,000 monthly budget ($749 divided by $50,000), though its actual price rises with GMV.
How we think about fit in the accounts we run:
- One or two paid channels, mostly Meta. Platform reporting on a fixed window, store data and a post-purchase survey answer most questions. A multi-touch tool is hard to justify yet.
- Three or more paid channels with real spend on each. A multi-touch tool earns its place by putting channels on one scale, provided someone owns the setup.
- Retail or marketplace sales alongside your own site. Expect every pixel-based tool to miss part of the effect, and budget for tests.
The tool is rarely the hard part. The definitions underneath it are: which revenue counts, which window, how a new customer is identified, and what the team does when two numbers disagree. A $219 tool fed clean events will serve you better than a $3,500 tool fed by a pixel that fires twice.
Do ad platforms always over-report?
No. The common assumption is that Meta and Google inflate their own results. In aggregate they can, since two platforms claiming one order is double counting by definition. But controlled tests show the error runs in both directions, and a brand that assumes over-reporting everywhere can end up cutting spend that was working.
Haus, which sells incrementality testing, analyzed 640 of its experiments and published the results on 28 July 2025 (Haus, 28 July 2025). Meta drove about 19% lift on average to the brand’s primary KPI. Where a brand sold only through its own site, Meta’s in-platform 7-day click attribution under-reported incrementality by 15% on average. For omnichannel brands, 32% of Meta’s impact landed in sales outside the brand’s own site, where no pixel can see it.
A year later the picture moved again. Haus reported on 16 July 2026 that Meta’s incremental attribution beat standard attribution on incremental ROAS by a pooled geo-mean of 1.26x between July 2025 and June 2026, after trailing at 0.80x the year before (Haus, 16 July 2026). The same option went from worse to better within twelve months. That argues for retesting attribution settings on a schedule rather than choosing one and assuming it holds.
What follows for a brand at $50,000 a month or more:
- With Amazon or retail distribution, expect Meta’s own numbers to miss part of Meta’s effect, and do not cut Meta on platform ROAS alone.
- Selling only on your own site, Meta’s 7-day click view can under-credit Meta, as it did on average in Haus’s tests, even while the sum of all platforms over-credits the business as a whole.
- An average across hundreds of experiments does not tell you where your account sits. Only a test on your account does.
These are averages from one vendor’s customer tests, and a company that sells testing has a reason to show that platform numbers need checking. We still treat them as the most useful public evidence on direction, because they compare platform claims with controlled experiments rather than with another model.
Which number should a $50K a month brand trust?
Trust depends on the decision in front of you. We use a simple order of authority:
- Business decisions, such as total budget and whether growth is profitable: blended ROAS, calculated as store revenue divided by total ad spend, read next to new-customer revenue and contribution margin.
- Channel decisions, such as moving budget from Meta to Google: a multi-touch tool or survey view, checked with a test when the shift is large.
- In-channel decisions, such as which campaign, ad set or creative to scale: the platform’s own reporting on one fixed window, because it holds the most signal at that level.
- Disputes between the layers: an incrementality test.
A womens fashion brand we work with shows why the anchor matters. Its blended ROAS was 2.77x between January and August 2026, up 5% on January to August 2025, measured in its Triple Whale account. The team steers by that figure because it cannot double count: every order appears once in the revenue, and every dollar from every channel appears once in the spend. It says nothing about which channel caused which sale, and no incrementality test was run on that period, so it cannot tell us whether Meta, Google or email earned the improvement.
Blended ROAS has limits of its own. It can rise because returning customers buy more while acquisition weakens underneath, and it can hide a losing channel inside a healthy total. So we read it with new-customer revenue beside it and platform numbers below it, never in place of them. The same logic reaches automated bidding, which optimizes toward whatever conversion signal it receives. Feed it a double-counted signal and it learns the wrong lesson, a point we take further in AI Runs the Ads Now. Who Runs the AI?
How do you set up attribution you can act on?
Setup order matters more than tool choice. This is the sequence we follow:
- Write the definitions down. Which revenue counts (gross, after discounts, after returns), what makes a customer new, which ROAS is the anchor, and what margin assumption sits under the target.
- Fix collection before modeling. Meta’s guidance is to run the Conversions API alongside the Meta Pixel, sending the same events through both, because the API can recover events the pixel misses when a connection drops or a page fails to load (Meta for Developers). Deduplicate so each order is counted once. Google Tag Manager runs on 45.1% of all websites and on 99.6% of sites whose tag manager is known (W3Techs, September 2026), so on many stores the container is the first place to look for duplicate or orphaned tags.
- Choose one attribution setting per platform and freeze it. Log the window, the date you set it, and any platform change that alters it, such as Meta’s March 2026 change.
- Add a post-purchase survey for the channels pixels cannot see, such as podcasts, creators and word of mouth.
- Agree a reporting rhythm. Blended numbers daily, channel reads weekly, budget decisions monthly against the anchor.
- Put tests on the calendar. Pick the budget question that matters most each quarter and test that one.
Two timing notes. If you are not sure the tracking underneath is sound, work through the checks in our ecommerce audit guide before trusting any model. And settle windows well before peak season: a window changed in November makes Black Friday hard to compare with anything, and Meta budget pacing for Black Friday is only as good as the numbers it is read on. If you would rather have one team own this end to end, see how our tracking and attribution service is set up.
We build measurement for ecommerce brands with $50,000 or more in monthly ad spend, from the Conversions API through to the order of authority above. Bring your Meta, Google and Shopify numbers to a free 30 minute growth audit and leave knowing which of them to act on first.
Common questions
What is the best attribution model for ecommerce?
No single model is best, because each one answers a different question. The setup that holds up for most brands is layered: blended ROAS from store data for business calls, data-driven or platform attribution on a fixed window for daily optimization, and incrementality tests to settle arguments about channel budgets. In GA4 the choice is narrower than it once was, since only data-driven and last-click options remain after November 2023.
Is Triple Whale or Northbeam more accurate?
We know of no independent public test that ranks them, so treat any claim either way as unproven. Both are models, and both depend on what you feed them: clean events, correct order data and consistent definitions. Price and fit differ more clearly than accuracy does. The better question is which tool your team will set up properly and actually read every week.
Do I need a post-purchase survey if I have an attribution tool?
Usually yes, because a survey measures something a tool cannot: what the buyer remembers. It picks up podcasts, creators, word of mouth and offline exposure that never produce a click. It carries its own bias, since memory is imperfect and the answer list shapes responses. The cost is low, with published plans starting at $19 a month at KnoCommerce.
How often should we run an incrementality test?
Run one whenever a budget decision is big enough that being wrong would hurt, and before you scale or cut a major channel. For many brands at this size that means a few tests a year rather than a permanent program. Retest after platform changes too: in Haus’s data, Meta’s incremental attribution went from trailing standard attribution to beating it within a year, so an old result can expire.
Related reading
- AI Runs the Ads Now. Who Runs the AI?: why automated bidding is only as good as the signal it learns from
- Meta Ads for Black Friday: Structure and Budget Pacing: pacing Meta spend once the measurement is settled
- BFCM 2026 Paid Media Calendar for Ecommerce Brands: the peak-season timeline that tracking changes need to fit around
- What Does a Fractional CMO Actually Do? Scope and 90 Days: who owns the definitions behind the numbers
- GMV Max on TikTok Shop: How It Works, What It Hides and When to Use It