
An ecommerce audit should check four areas in a fixed order: tracking, unit economics, paid media structure, then site speed and checkout. The numbers come first because every later finding depends on them. A useful audit ends with a short list of fixes ranked by money at stake, each with an owner and a way to verify it.
We wrote this for ecommerce brands spending $50K or more a month on paid media, where one tracking error or one margin leak is large enough to show up in a single month’s results.
What should an ecommerce audit cover?
Search for an ecommerce audit and most results describe an SEO crawl or a technical site review. Both are useful, and both answer a narrower question than the one a growing brand is asking. A crawl tells you whether Google can read the site. A growth audit tells you whether the business can buy customers at a profit and keep doing it next quarter.
That question runs through the four layers named above, and the sequence matters more than the list itself. If the purchase event double counts, every return on ad spend figure built on it is inflated, and a paid media review that trusts those figures will move budget in the wrong direction. If contribution margin is thinner than the team believes, a campaign that looks efficient inside the ad account can lose money on every order it wins. Site speed and checkout come last, not because they matter least, but because you need numbers you trust to size the gain from fixing them.
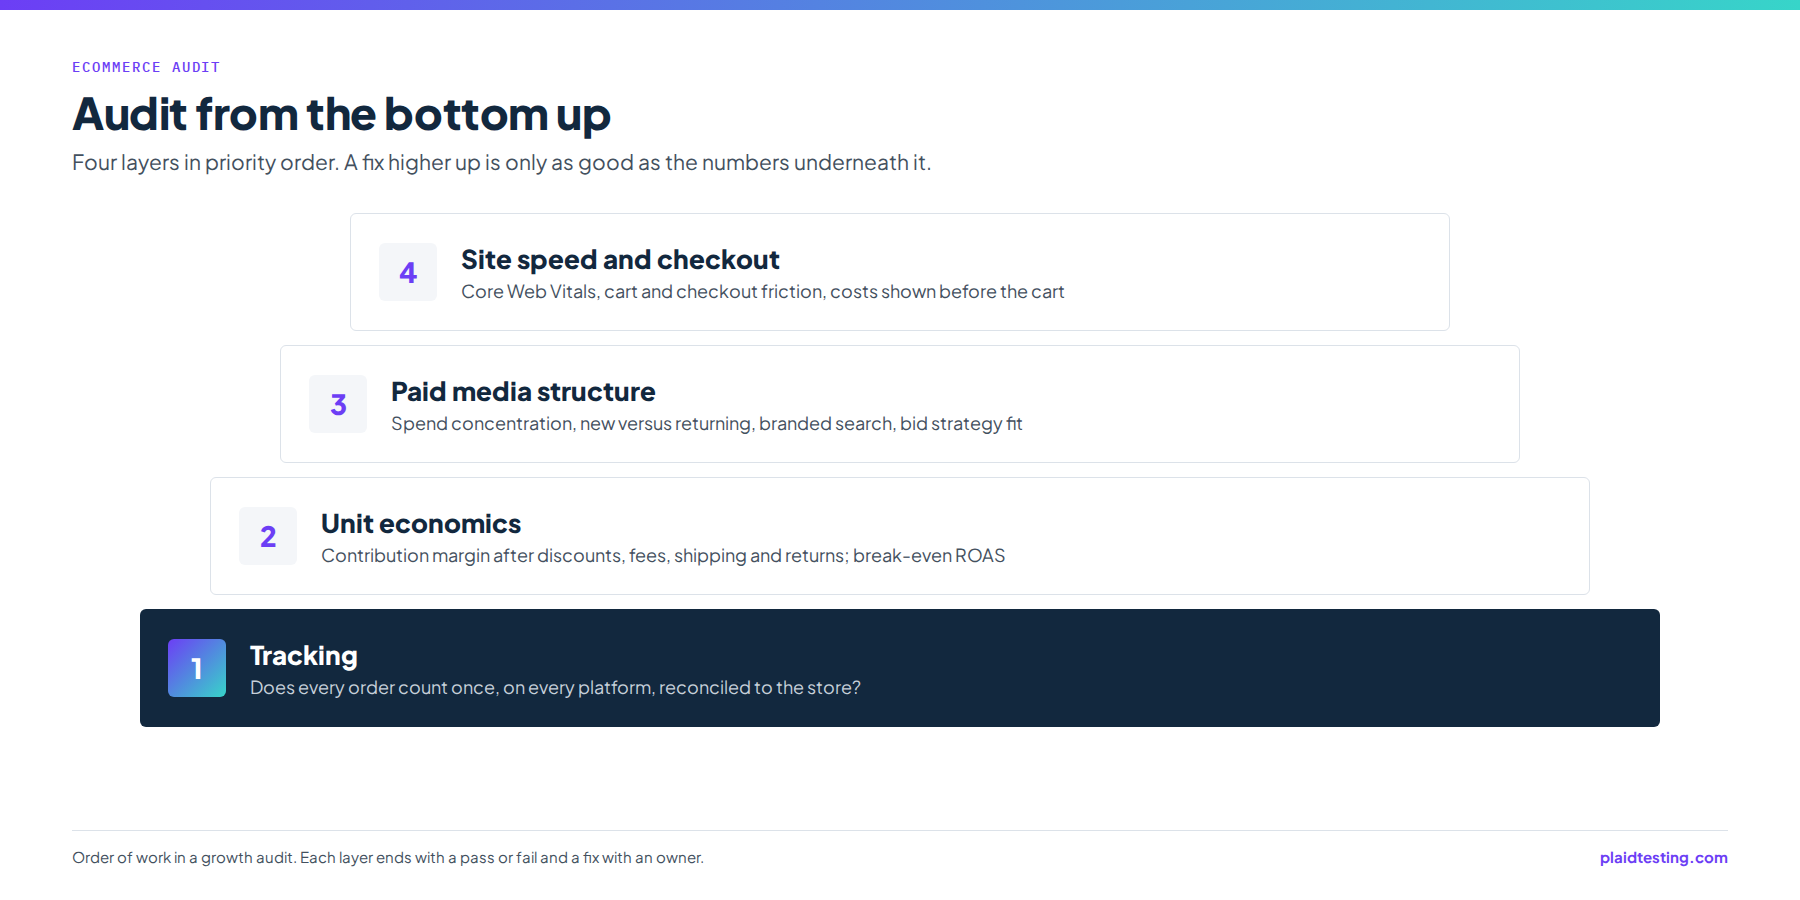
Each layer gets the same treatment: one question, the evidence we ask for, and what a fail looks like. The scorecard below is the working version, and it is deliberately short. An audit that lists everything and ranks nothing tends to change nothing, because no one can tell which few items pay for the rest.
| Area | Question | Evidence we ask for | What a fail looks like |
|---|---|---|---|
| Tracking | Does each order count once, on every platform? | A week of store orders next to purchase counts from Meta, Google Ads and GA4 for the same days | A platform reports more purchases than the store took, or nobody can explain the gap |
| Tracking | Do events reach Meta from both the browser and the server? | Event sources in Meta Events Manager; the live Google Tag Manager container | Pixel only, duplicate purchase tags, or a purchase trigger tied to a page view |
| Unit economics | What does an order contribute after every variable cost? | Margin by product or category; shipping, fulfillment and payment fee rates; a year of returns by SKU | No break-even ROAS exists, or it was calculated before returns |
| Paid media | Does the account optimize for purchases, with enough volume per campaign? | Read-only access; spend and conversions by campaign for the last 90 days | Campaigns optimizing for clicks or add to carts, or budget spread too thin for any campaign to learn |
| Paid media | Is new-customer acquisition visible? | New and returning customer revenue by month; branded search spend | Only total ROAS is reported, so acquisition cannot be seen at all |
| Site speed | Do paid landing pages pass Core Web Vitals on mobile? | Field data for the top product and collection pages | Any of LCP, INP or CLS outside the good range at the 75th percentile |
| Checkout | Where do shoppers leave, and why? | Cart to purchase funnel by device; a recorded test purchase on a phone | Costs appear only at the last step, account creation is forced, or mobile completion trails desktop with no explanation |
Can you trust the numbers? Start with tracking
We check tracking first because every later conclusion in an audit rests on it, and because it fails quietly. The test is simple and often skipped. Pick a recent week, export orders from the store, then pull purchase counts for the same days from each ad platform and from GA4. The store is the ledger. The platforms will never match it exactly, since each counts under its own attribution rules, but the gap should be stable, explainable and written down. A platform reporting more purchases than the store took over the same period is the clearest warning sign, and duplicate purchase events are the first thing to rule out.
Next is how events reach the platforms. Meta recommends running the Conversions API in addition to the Meta Pixel and sending the same events through both, since the server connection can share events the pixel loses to connectivity or page loading errors (Meta for Developers). A pixel-only setup fails this check. So does a server connection that nobody has tested since it was switched on.
Then the tag container. W3Techs finds Google Tag Manager on 45.1% of all websites, a 99.6% share among the sites whose tag manager it can identify (W3Techs, September 2026), so when a store runs a tag manager at all, it is almost always this one, and it is where purchase tags, consent settings and leftovers from old tools sit side by side. We look for tags that fire twice, tags from vendors the brand no longer uses, and purchase triggers tied to a page view rather than a confirmed order.
In Google Ads we check which conversion actions bidding is told to optimize toward. Data-driven attribution is the default for most conversion actions, and Google’s recommended volume for it is at least 200 conversions plus 2,000 ad interactions in supported networks within 30 days (Google Ads Help). That is a recommendation rather than a hard minimum, but an account well below it should read campaign-level attributed numbers with extra caution.
Last, agree one blended number: store revenue against total ad spend, or new-customer orders against spend. Platform reports can be wrong in either direction. In a review of 640 incrementality experiments, Haus found that Meta’s 7-day click attribution, on average, under-reported incrementality by 15% for brands selling only through their own site (Haus, 28 July 2025). A blended number cannot double count, which is why it anchors everything else. This layer is the core of our tracking and attribution work.
If you would like this layer checked before anything else, the free growth audit begins with a tracking review, reads your account structure, and closes with three fixes your team can act on.
Do the unit economics hold up after returns and fees?
Once the numbers can be trusted, the next question is whether the orders they count make money. We build contribution per order from the bottom up: the price actually paid after discounts, minus product cost, shipping, pick and pack, payment fees and the expected cost of returns. Divide average order value by that contribution and you have break-even ROAS, the return on ad spend at which an order just pays for its own acquisition. The audit question is not what the target ROAS is, but whether anyone can show how it was derived and whether it still holds at current costs.
Returns are the line we check hardest, because online they are large and they arrive after the revenue has been booked. NRF and Happy Returns expected 15.8% of annual US retail sales to be returned in 2025, $849.9 billion in total, and 19.3% of online sales (NRF, 15 October 2025). The same report estimated that 9% of returns were fraudulent, and that 82% of consumers call free returns a major consideration. That last figure is why a tighter returns policy is a trade-off to test rather than a free saving.
A return is also a margin line an audit should read month by month, because it reverses a sale after the ad that won it has already been paid for. For an athletic apparel brand we work with, returns fell 10.2% to $17.7K in June 2026 against June 2025, per its Triple Whale account. That is a single month, and the report does not show what caused the decline, so we treat it as a line to keep watching rather than a result to credit to anything.
The pass test for this layer is short. Break-even ROAS exists by product or category, it is calculated after returns and payment fees, and the paid media targets sit above it with room to spare. If any part of that is missing, the paid media review that follows has nothing to measure against, and a campaign can hit its target while the business loses money.
Is the paid media structure sound?
Many audits open with the ad account. We put it third on purpose, because structure only makes sense once there is a purchase signal to trust and a break-even point to aim above. With those in place, the account structure read covers four questions.
First, what does each campaign optimize toward? A campaign bidding for add to carts or landing page views when the business needs purchases will find the cheapest version of the wrong behavior. Second, how many campaigns share the budget? Automated bidding learns from conversions, so spreading spend across many small campaigns leaves each with too little signal to learn from. Consolidation is often the fix, and it is rarely the exciting one.
Third, how is revenue split between new and returning customers? Returning buyers and branded searches convert cheaply and are easy to over-credit, so an account that reports only total ROAS can look healthy while acquisition stalls. We ask for new-customer revenue next to spend, by month, for the past year. Fourth, what is the creative testing rhythm? We want to see how many new concepts went live last quarter, how each one was judged, and whether a written readout exists for the ones that were cut.
For Shopping and Performance Max, the product feed is part of the structure, because titles, descriptions and availability decide which searches a product can appear for. Our guide to Google Shopping management and what it should cost covers that work in detail. If the audit falls between August and October, the BFCM 2026 paid media calendar shows where each fix needs to land before peak season.
When this layer fails, the answer is rarely a new channel. It is usually fewer campaigns, one clean purchase goal and a new-customer number on the weekly report. That is the day-to-day work of our paid media service.
Are site speed and checkout costing you orders?
This is the easiest layer to hold to published thresholds, so we use hard numbers here and judgment elsewhere. For speed, Google’s Core Web Vitals define a good experience as Largest Contentful Paint within 2.5 seconds, Interaction to Next Paint of 200 milliseconds or less and Cumulative Layout Shift of 0.1 or less, each measured at the 75th percentile of page loads (web.dev, 31 October 2024). We read field data for the product and collection pages that receive paid traffic, on mobile first, rather than a single lab test of the homepage.
The commercial case is documented. In a Google and Deloitte study of 37 brand sites and 30 million sessions, a 0.1 second improvement in mobile site speed increased retail conversion rates by 8.4% and retail spend by 9.2% (web.dev, 24 June 2020). We use that to size a speed fix, not to promise a result from one.
Checkout is next. Baymard Institute puts the average documented cart abandonment rate at 70.22%, an average of 50 studies (Baymard Institute, updated 22 September 2025). Much of that is people browsing, and no audit removes it. The part an audit can act on sits in the reasons US shoppers gave when they abandoned for something other than browsing, listed in the table below. Baymard also estimates that the average large ecommerce site can gain a 35.26% increase in conversion rate through better checkout design.
Conversion rate benchmarks help less than people hope. Shopify cites Statista at 1.4% of global ecommerce visits converting in Q1 2026 and Dynamic Yield at 2.66% across 400+ brands, with beauty at 5.32%, fashion at 2.77% and home and furniture at 1.29% (Shopify, updated 22 August 2026). On those figures beauty converts at about four times the rate of home and furniture (5.32% against 1.29%), so a cross-category average says little about one store. We compare a site with its own history, by device and traffic source, before comparing it with anyone else.
| Check | Pass threshold or benchmark | Source | How we test it |
|---|---|---|---|
| Largest Contentful Paint | 2.5 seconds or less at the 75th percentile | web.dev Core Web Vitals | Mobile field data for the pages taking paid traffic |
| Interaction to Next Paint | 200 milliseconds or less at the 75th percentile | web.dev Core Web Vitals | Field data, then tap through size pickers, filters and add to cart by hand |
| Cumulative Layout Shift | 0.1 or less at the 75th percentile | web.dev Core Web Vitals | Field data; watch for late-loading banners, review widgets and pop-ups |
| Mobile speed, sized in revenue | 0.1 seconds faster lifted retail conversion rates 8.4% and retail spend 9.2% | Google and Deloitte, via web.dev | Used to estimate what a speed fix is worth, never as a forecast |
| Cost transparency | Extra costs too high: 40% of US shoppers who abandoned for a non-browsing reason | Baymard Institute | Shipping and tax visible before the payment step on mobile |
| Delivery promise | Delivery too slow: 20% | Baymard Institute | Delivery estimate shown on the product page and in the cart |
| Guest checkout | Site wanted an account created: 18% | Baymard Institute | Complete a purchase without creating an account |
| Checkout length | Too long or complicated checkout: 17% | Baymard Institute | Count steps and form fields from cart to confirmation on a phone |
What does a useful audit deliverable look like?
A good audit is short enough to act on in the week it arrives. Whoever runs it, whether your own team, an outside partner or us, we would hold the deliverable to five tests.
- Every finding shows its evidence. A screenshot, an export or a number the brand can reproduce, not an opinion stated with confidence.
- Findings are ranked. By money at stake first and effort second, so the first three items are obviously the first three.
- Each fix has an owner and a date. A finding nobody owns is a note, not a fix.
- Each fix says how to verify it. For a tracking fix, the reconciliation that should now close; for a checkout fix, the step where drop-off should fall.
- It states what it could not check. Missing access, missing data and short date ranges belong in the body of the report, not in a footnote nobody reads.
What a deliverable should not be: a crawl export with hundreds of warnings, or a list of best practices with no link to this brand’s numbers. If the fixes need people the brand does not have, the report should say so plainly. Some brands run the fixes in house; others bring in a fractional marketing team to own tracking, media and creative together.
Our own free growth audit is the compressed version of this framework. It takes 30 minutes, costs nothing and needs no retainer to start. It covers a tracking review, a read of your account structure and three fixes, and we guarantee actionable takeaways. We are honest about its scope: 30 minutes is enough to find the largest problem in tracking and account structure, not to rebuild a margin model or test every checkout path. If the three fixes are all you need, take them and run them yourself.
Spending $50K or more a month on ads without one purchase number the whole team trusts? Book a free 30 minute growth audit with Plaid Testing and we will start with the tracking.
Common questions
How long does an ecommerce audit take?
Our free growth audit takes 30 minutes and stays within tracking, account structure and three fixes. A full audit across all four layers takes longer, and most of that time goes on getting access and exports rather than on analysis. Granting read-only access to the store, ad accounts, analytics and tag manager before the first call is the simplest way to shorten it.
What is the difference between an ecommerce audit and an SEO audit?
An SEO audit asks whether search engines can crawl, index and rank the site. An ecommerce growth audit asks whether paid and owned channels bring in customers at a profit, which means tracking, margin, account structure and checkout. The two overlap on site speed. If organic search is a major revenue line, run both, starting with whichever touches more revenue.
How often should a brand run one?
We suggest a full pass once a year, plus a tracking check before any major sales period or platform change, such as a theme migration, a new checkout app or a switch in attribution settings. Tracking breaks without warning, so the cheapest habit between audits is a monthly reconciliation of store orders against the purchases each platform reports.
What should we prepare before an audit?
Read-only access to the store admin, each ad account, GA4, Google Tag Manager and Merchant Center if you run Shopping. A margin sheet by product or category that includes shipping, fulfillment and payment costs. Returns by SKU for the past year. And a one-line answer to what the business most needs to grow next quarter, because every fix gets ranked against that goal.
Related reading
- BFCM 2026 Paid Media Calendar for Ecommerce Brands: for scheduling audit fixes ahead of peak season
- AI Runs the Ads Now. Who Runs the AI?: on the human decisions that sit above automated bidding
- Google Shopping Agency: What to Expect and Pay: the feed and Shopping checks in more depth
- What Does a Fractional CMO Actually Do? Scope and 90 Days: who owns the fixes once the audit is done