
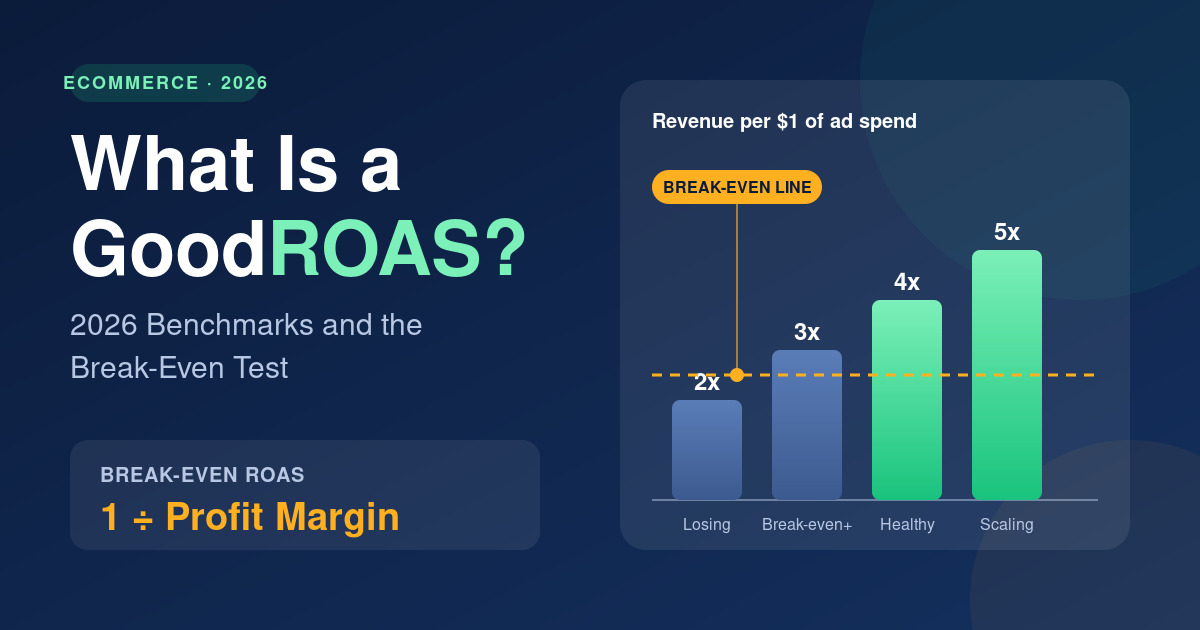
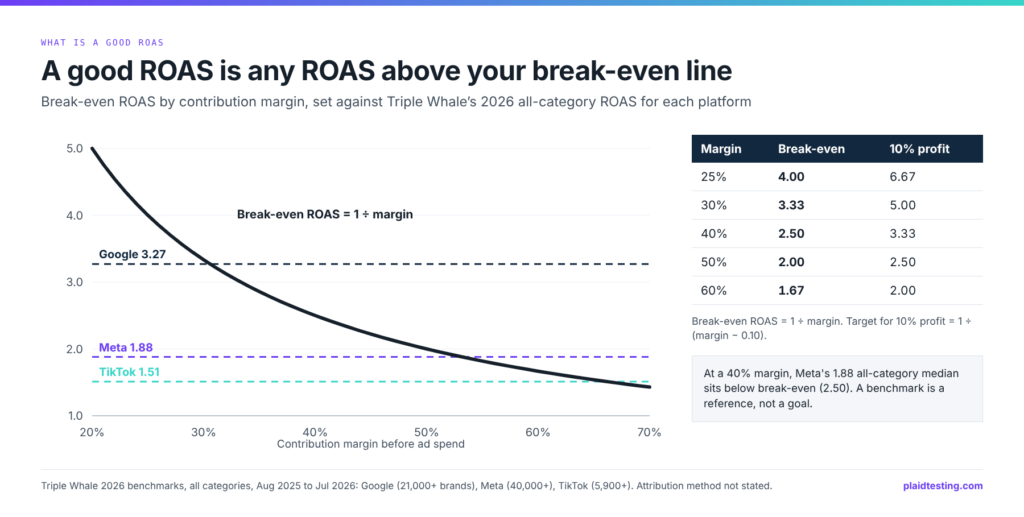
A good ROAS is any ROAS above your break-even ROAS, which is 1 divided by your contribution margin before ad spend. A store that keeps 40% of each order breaks even at 2.50 and needs about 3.33 to keep 10% profit. Platform averages, such as Meta’s 2026 all-category median of 1.88, are context, not targets.
The question gets asked constantly because the answers in circulation are rules of thumb, usually “3 to 4”, with no margin attached. The auction moved under those rules in 2026. Meta’s average price per ad rose 12% year over year in the second quarter, on 14% more ad impressions (Meta, 29 July 2026), and Northbeam’s first-half review of its advertisers found median customer acquisition cost up 10.3% while revenue grew 3.32% (Northbeam, 6 August 2026). When each sale costs more, a target borrowed from someone else’s margin either starves a profitable account or funds a losing one.
What do the 2026 benchmarks say about ROAS by platform?
The broadest public reference is Triple Whale’s set of 2026 benchmarks, each covering August 2025 to July 2026 against the prior twelve months. They show how far apart the channels sit before margin enters the conversation. Google’s all-category figure is 3.27, Meta’s median is 1.88 and TikTok’s figure is 1.51, so a single “good ROAS” across all three would be too strict for one channel and too loose for another.
| Platform | All categories, 2026 (prior year) | Apparel and accessories, 2026 | Sample |
|---|---|---|---|
| Google Ads | 3.27 (3.39) | 3.99 | 21,000+ brands |
| Meta (Facebook and Instagram) | 1.88 (1.86) | 2.24 | 40,000+ brands |
| TikTok | 1.51 (1.43) | 2.70 | 5,900+ brands |
Sources: Triple Whale benchmarks for Google (updated 20 August 2026), Meta (updated 17 August 2026) and TikTok (updated 20 August 2026).
Three things keep these figures from becoming targets. First, the pages do not state an attribution method, so a brand reading its own Ads Manager on a different window is comparing unlike numbers. Second, category moves the result more than the platform average admits: TikTok’s health and wellness figure is 0.42 against 2.70 for apparel and accessories. Third, Google’s higher number partly reflects the searches it captures from people who already know the brand. The same Triple Whale data shows brands putting 22.50% of ad spend on Google and 66.88% on Meta, and that split is a reasonable first check of your own mix before any ROAS comparison means much.
How do you calculate the ROAS you need to break even?
Start from what an order leaves after the costs that rise with every sale: product cost, shipping and fulfilment, payment processing, returns and refunds, and discounts. What remains, as a share of order value, is contribution margin before ad spend. Break-even ROAS is 1 divided by that margin, and the ROAS that keeps a chosen profit margin is 1 divided by the margin minus that profit share.
| Contribution margin before ads | Break-even ROAS | ROAS for 10% profit | ROAS for 20% profit |
|---|---|---|---|
| 25% | 4.00 | 6.67 | 20.00 |
| 30% | 3.33 | 5.00 | 10.00 |
| 40% | 2.50 | 3.33 | 5.00 |
| 50% | 2.00 | 2.50 | 3.33 |
| 60% | 1.67 | 2.00 | 2.50 |
The table shows why a single answer cannot work. A brand with a 60% contribution margin is profitable at Meta’s 1.88 median; a brand at 30% loses money at Google’s 3.27. The most common mistake is using gross margin in place of contribution margin. A 2026 benchmark of 18 private brands by Ecom CFO and A2X put average gross margin at 67.09% for brands under $10 million in revenue (A2X, 3 March 2026), but gross margin is measured before shipping, payment fees and returns. In the worked example in our calculator, those three take 20 points off a $100 order. Use the break-even ROAS calculator to build the figure from those parts rather than guessing it.
The platforms say the same in their own words. Google’s guidance is to “set a ROAS target based on what will yield the highest profit” and to consider cost of goods sold and customer lifetime value (Google Ads Help). Amazon tells sellers to keep advertising cost of sales below profit margin, with break-even as the first target (Amazon Ads). Neither gives a formula, which is why the arithmetic above is worth doing once and writing down.
Why does a good ROAS depend on new versus returning customers?
ROAS counts every order in the revenue line, including repeat orders from customers who would have come back through email, search or habit. For a brand with a loyal base, that flatters the ratio. The question a growth budget has to answer is narrower: what did the spend return in revenue from people who had never bought before? That figure, revenue from first-time customers divided by ad spend, is new customer ROAS, usually written NC-ROAS.
At an athletic apparel brand we work with, June 2026 closed at a blended ROAS of 3.77, store sales divided by ad spend across every channel, per its Triple Whale account. Revenue from first-time buyers, which is sales less the $759,500 that returning customers spent, came to about $970,500 against $457,400 of ad spend: a new customer ROAS of about 2.1. Both numbers describe the same month and the same budget. The figure is blended across all paid channels rather than credited to any one of them, it was not checked with an incrementality test, and product and merchandising decisions moved it alongside media. It still makes the point: the brand judged its ads on 2.1, not 3.77.
Whether 2.1 is good depends on what the brand needs a first order to do. If the first order must pay for itself, the bar is break-even on first-order margin. If repeat purchases reliably follow, the bar can sit lower, as long as the payback period is known rather than hoped for. Our guide to calculating NC-ROAS covers both cases, and Google’s customer lifecycle goals let advertisers bid higher for new customers in Search, Performance Max, Shopping and Demand Gen (Google Ads Help) so bidding can reflect the same priority.
If you are not sure which of your ROAS numbers counts repeat buyers, that is the first thing our tracking and attribution work separates, before any target gets set.
Platform ROAS, blended ROAS or MER: which one should be good?
Each platform reports the revenue it believes it caused, inside its own attribution window, so the same order can appear in Meta’s report, Google’s report and an email report at once. That makes platform ROAS useful for comparing campaigns and ads inside one account, and unreliable as a verdict on the channel. It is not always generous, either. Across 640 Haus incrementality experiments, Meta’s 7-day click reporting under-counted measured incrementality by 15% on average for brands that sell only on their own site (Haus, 28 July 2025). A platform number can be wrong in either direction, which is why the store’s own figures have to anchor the definition of good, with each platform read against them.
| Measure | Formula | What “good” means | Use it for |
|---|---|---|---|
| Platform ROAS | Revenue a platform credits to itself ÷ spend on that platform | Above the level that has historically matched profitable store results | Comparing campaigns, ad sets and ads inside one account |
| Blended ROAS | All store revenue ÷ all paid media spend | Above break-even ROAS on contribution margin | Judging whether total ad spend is working |
| NC-ROAS | Revenue from first-time customers ÷ all paid media spend | Above the first-order break-even, or a known payback plan | Judging whether ads are growing the customer base |
| MER | All store revenue ÷ all marketing spend, fees and tools included | Inside the marketing budget the business plan allows | Board-level efficiency and planning |
In the accounts we run, “good” is defined on the store side first: blended ROAS above break-even and NC-ROAS above the first-order bar. Each platform’s own ROAS is then read against its history to see whether it moves with those store numbers. A platform ROAS that climbs while blended results and new customers stay flat is collecting credit, and its target should not be raised to match. The paid media management page sets out how those numbers drive budget across channels.
When is a ROAS below break-even the right call?
Break-even is a floor for the business, not for every campaign. Three situations justify spending below it on purpose. The first is acquisition with proven repeat margin: if customers acquired at an NC-ROAS of 1.6 reliably buy again within 90 days, the first order can lose money by design, provided the payback is measured in cohorts rather than assumed. The second is a launch, where early spend buys the data and the creative learning that later campaigns run on, and the loss is capped in advance. The third is clearance, where turning slow stock into cash beats holding it at full cost.
The opposite case matters as much. A campaign far above target is often a sign of under-spending rather than success, because average ROAS usually falls as budget rises and a very high average can hide plenty of room above break-even. The useful question is what the next dollar returns, which is marginal ROAS, not what the budget returned on average. A campaign at 5.0 with a break-even of 2.0 has headroom; a campaign at 2.4 whose last increase of budget returned 1.3 does not, even though its average still looks safe.
Seasonality changes the reading too. Prices in the auction usually climb into November, so a ROAS that is good in October may be unreachable during peak weeks, and the target for those weeks should be set from margin and planned volume rather than carried over. Our Black Friday budget pacing guide shows how we set peak targets for Meta.
How should you set a ROAS target for each platform?
We set targets in four steps. First, calculate contribution margin per order from real costs, not gross margin, and turn it into break-even ROAS. Second, choose the profit share the business wants from paid media and turn that into a blended target ROAS with the formula above. Third, decide the new customer bar: the NC-ROAS that keeps first orders at or above break-even, or the lower figure a measured payback period supports. Fourth, translate those store-side targets into each platform’s own reporting.
That last step is where most targets go wrong. Over four clean weeks in which the store hit its blended target, compare each platform’s reported ROAS with the blended ROAS the store recorded, and note the ratio. If Google’s own ROAS ran at 1.2 times the blended figure in those weeks, a blended target of 3.0 translates to about 3.6 inside Google’s bidding; if Meta’s reported ROAS ran below the blended figure, its in-platform target sits below the store target. Google is renaming “Maximize conversion value with a target ROAS” to “Target ROAS” from June 2026 without changing how it works (Google Ads Help), so older guides will not match the interface, but the input is the same number.
Recheck the ratio monthly and after any tracking change, because a new pixel, a consent setting or a window change moves platform revenue without moving sales. The Meta attribution window guide explains how far a window change alone can shift reported ROAS.
Want a ROAS target built from your own margins rather than a benchmark? Book a free 30 minute growth audit and we will work out your break-even, blended and new customer targets with you, using your store data.
Common questions
Is a 4x ROAS good?
It is good if your contribution margin is above 25%, because 4.0 is the break-even point at a 25% margin. A brand keeping 50% of each order makes money from 2.0 upward, so 4.0 would be strong; a brand keeping 20% needs 5.0 just to break even. Work out break-even ROAS as 1 divided by contribution margin before judging any ROAS figure.
What is a good ROAS percentage?
ROAS written as a percentage is the same ratio multiplied by 100, so a ROAS of 3.0 is 300%. A good percentage is anything above your break-even, which is 100 divided by your contribution margin as a decimal: 250% at a 40% margin, 200% at 50%. A percentage below 100% means the ads returned less revenue than they cost.
What is a good ROAS for Facebook ads?
Triple Whale’s 2026 Meta benchmark, across more than 40,000 brands, puts the all-category median at 1.88 and apparel and accessories at 2.24. Whether either is good for you depends on your break-even ROAS. Judge Meta on blended store results and new customer revenue as well, since Meta’s own ROAS depends on the attribution window it uses.
What is a good ROAS for Google Ads?
Triple Whale’s 2026 Google benchmark shows 3.27 across all categories and 3.99 for apparel and accessories, from more than 21,000 brands. Google’s figure is higher than Meta’s partly because it captures branded searches from people who already intended to buy, so separate brand from non-brand campaigns before deciding what a good Google ROAS is for your store.