
A customer acquisition cost calculator divides everything you spent to win new customers by the number of new customers you won, then shows how much of that cost the first order pays back. For an ecommerce brand the CAC figure alone is half the answer; the other half is first-order contribution and how many months the remainder takes.
That second half matters more each year, because reaching a buyer keeps getting dearer. Meta’s average price per ad was 12% higher in the second quarter of 2026 than a year earlier (Meta, July 2026), and the median Meta cost per acquisition in Triple Whale’s benchmark of over 40,000 brands reached $38.99 for August 2025 to July 2026, up 3.14% (Triple Whale, August 2026). A brand that knows its break-even CAC can keep buying growth as prices rise. Below: how to use the calculator, the formulas behind it, where each input should come from, what a sensible LTV to CAC ratio looks like for a store, and the levers that bring CAC down.
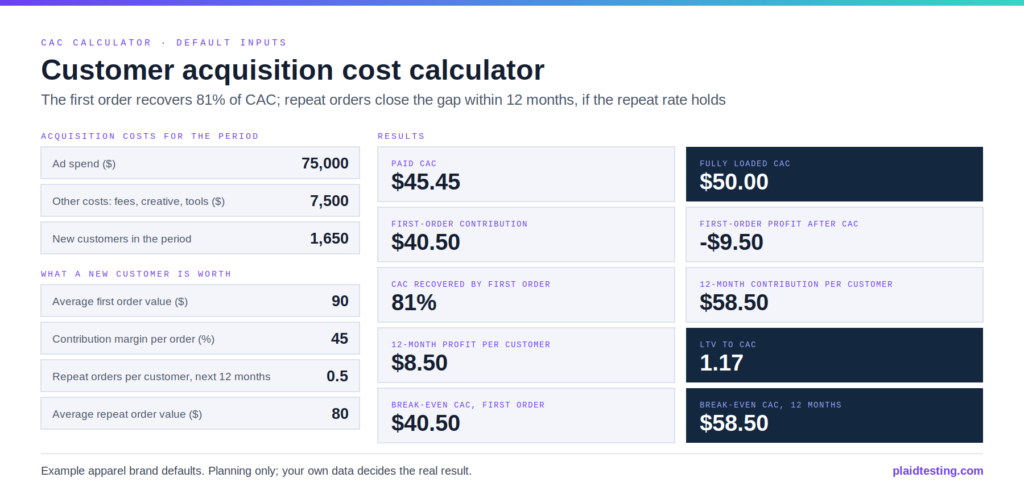
The live calculator shows ten results and updates as the reader types.
How To Use The Customer Acquisition Cost Calculator
Enter one period’s numbers, a month or a quarter, with every input on the same dates. Ad spend is what all paid channels billed. Other acquisition costs are what you spent winning customers outside the ad accounts: management fees, creative production, influencer and affiliate payments, and the acquisition share of software. New customers is the count of people who placed their first ever order in the period, not the number of orders. Average first order value is what they spent on that order, after discounts. Contribution margin is what each order leaves once product cost, shipping, payment fees and returns are paid, before advertising.
The last two inputs cover the following 12 months: repeat orders per new customer and their average value. Take both from your own cohort history, since they decide whether a first-order loss is an investment or simply a loss.
At the defaults, $75,000 of ad spend plus $7,500 of other costs brings in 1,650 new customers, for a paid CAC of $45.45 and a fully loaded CAC of $50.00. A $90 first order at a 45% margin leaves $40.50, so the first order falls $9.50 short and recovers 81% of CAC. Half a repeat order at $80 adds $18.00, taking 12-month contribution to $58.50 and 12-month profit to $8.50 per customer.
| Output | Formula | At the default inputs |
|---|---|---|
| Paid CAC | Ad spend ÷ new customers | $75,000 ÷ 1,650 = $45.45 |
| Fully loaded CAC | (Ad spend + other acquisition costs) ÷ new customers | $82,500 ÷ 1,650 = $50.00 |
| First-order contribution | First order value × contribution margin | $90 × 45% = $40.50 |
| First-order profit after CAC | First-order contribution − fully loaded CAC | $40.50 − 50.00=-9.50 (81% of CAC recovered) |
| 12-month contribution per customer | First-order contribution + repeat orders × repeat order value × margin | $40.50 + 0.5 × $80 × 45% = $58.50 |
| 12-month profit per customer | 12-month contribution − fully loaded CAC | $58.50 − $50.00 = $8.50 |
| LTV to CAC | 12-month contribution ÷ fully loaded CAC | 1.17 |
| Break-even CAC on the first order | First-order contribution | $40.50 |
| Break-even CAC within 12 months | 12-month contribution | $58.50 |
How To Calculate Customer Acquisition Cost: Paid CAC vs Fully Loaded CAC
The customer acquisition cost formula is acquisition spend divided by new customers acquired over the same dates. Two choices inside it move the answer more than any campaign does.
The first is the denominator. CAC divides by new customers, not by orders. Divide $75,000 by every order in the month, repeat purchases included, and you report a CAC far healthier than the real cost of finding someone new, with the gap widening as the returning base grows. Count people rather than orders: a new buyer who orders twice in the month is still one acquisition.
The second is the numerator. Paid CAC uses ad spend only, which keeps it comparable with platform reports and with last year. Fully loaded CAC adds management or agency fees, creative production, influencer and affiliate payouts, and the acquisition share of software. Paid CAC says how efficient the media was; fully loaded CAC says what a customer really cost the business, and that is the figure to hold against contribution. In the default example the two differ by $4.55, nearly half of the $9.50 first-order shortfall.
Two smaller rules keep it honest. Match dates exactly, since a promotion that spends late in one month acquires customers who order early in the next. And leave out costs that do not move with acquisition, such as retention salaries, or CAC drifts into an overhead ratio.
Where Should CAC Numbers Come From: Shopify, Triple Whale, Northbeam Or The Ad Platforms?
The new customer count should come from the store, the only system that sees every order. Shopify treats a first-time customer as someone placing their first order with the store, judged against their entire order history rather than the report dates, and its New vs returning customers report shows both counts for any period (Shopify Help Center). Attribution tools build on that. Triple Whale’s NCPA divides blended ad spend, including custom spend you add by hand, by new customer orders (Triple Whale documentation), and Northbeam defines CAC (New) as spend divided by transactions from new customers (Northbeam documentation).
Platform CPA works differently. Meta and Google count a purchase whenever their own attribution rules credit an ad, without separating new buyers from returning ones unless you set them up to, and two platforms can claim the same order. It is useful for comparing ads inside one platform and unreliable as the CAC you take to the P&L. A useful cross-check: when a platform’s reported results improve, new customer counts in the store should rise with them; if they do not, the platform is probably crediting itself with buyers who were coming anyway. If the four measures below disagree by more than you can explain, our tracking and attribution setup starts by reconciling store orders with what each platform claims.
| Metric | What it counts | Where to find it | Main blind spot |
|---|---|---|---|
| Paid CAC | Ad spend ÷ first-time customers | Platform billing plus Shopify’s New vs returning customers report | Leaves out fees, creative and tools, so it understates the full cost |
| Fully loaded CAC | All acquisition costs ÷ first-time customers | Finance: ad spend plus fees, production and tool costs for the same dates | Needs a fixed rule for which costs count; change the rule and the trend breaks |
| NC-CPA | Blended ad spend ÷ new customer orders | Triple Whale (NCPA), Northbeam (CAC (New)) | Each tool defines a new customer its own way, so check its count against Shopify |
| Platform CPA | Platform spend ÷ purchases that platform credits to itself | Meta Ads Manager, Google Ads | Includes returning buyers and orders other channels also claim, so acquisition can look cheaper than it is |
Why Judge Ecommerce CAC On First-Order Contribution And Payback, Not A 3:1 Rule?
Subscription software can wait for a customer to pay back because the customer is under contract and revenue arrives monthly. A store has no contract. Its repeat orders are a forecast, while the cash for acquisition leaves on day one.
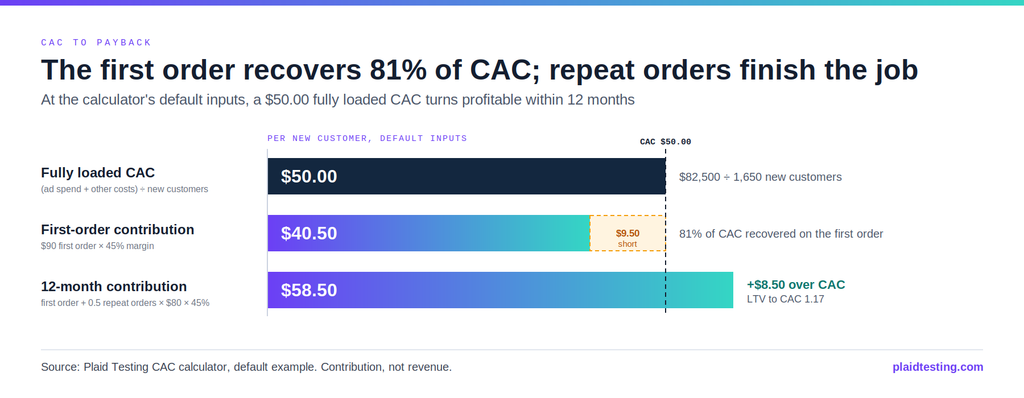
So start with first-order recovery: first-order contribution divided by fully loaded CAC. At the defaults it is 81%, so each new customer starts $9.50 in the red. In effect the business lends each customer $9.50 and waits for repeat orders to repay it; the questions are how long that takes and how much lending your planned spend implies.
The CAC payback period answers both. In orders, the default customer needs $9.50 more contribution, and one repeat order at $80 and a 45% margin leaves $36.00, so a single repeat order clears it. But the average customer places only half a repeat order a year, so the cohort’s money returns gradually. If those orders arrive evenly through the year, the cohort covers its $50.00 CAC a little after month six and finishes $8.50 ahead per customer. That cohort figure, in months, is the one to budget against.
For comparison, David Skok’s SaaS metrics guide says many of the best software companies recover CAC in 5 to 7 months, and that profitability turns weak once recovery runs past 12 months (For Entrepreneurs, updated June 2026). A store without contracts should usually want faster recovery than that.
What Is A Good LTV To CAC Ratio For Ecommerce?
The 3:1 rule of thumb comes from software. Skok’s guide describes the best SaaS businesses as running an LTV to CAC ratio above 3, sometimes 7 or 8, and calls them guidelines (For Entrepreneurs, 2013, updated June 2026). Ecommerce advice often repeats it: a January 2026 Shopify guide calls 3:1 the sweet spot and says ecommerce brands often range between 2:1 and 4:1 (Shopify, January 2026).
Many calculators measure LTV in revenue; this one uses 12-month contribution, the money actually available to repay CAC. Here is the same default customer on each basis:
| Measure | Revenue basis | Contribution basis (45% margin) |
|---|---|---|
| First order | $90.00 | $40.50 |
| Value over 12 months | $130.00 | $58.50 |
| LTV to CAC at a $50.00 CAC | 2.6 | 1.17 |
On revenue this customer sits near the 3:1 convention; on contribution the ratio is 1.17, a thin profit after a full year. Only the contribution figure says whether acquisition makes money. For most stores, a good LTV to CAC ratio on that basis is anything reliably above 1.0 inside a payback window the business can fund, with first-order recovery high enough that a weak repeat year does not sink the cohort. Brands with frequent reorders, such as supplements, can accept lower first-order recovery than apparel brands. Measure on real cohorts and refresh every quarter. The same margin logic turns into channel targets in what counts as a good ROAS.
How Do You Lower Customer Acquisition Cost?
Four levers move CAC.
Signal quality. Bidding systems find buyers from the purchase data you send back. Advertisers sending web events through the Conversions API saw cost per result 17.8% lower on average, according to Meta’s internal data (PPC Land, October 2026), and Google reports an average 11% lift in Search conversions with enhanced conversions compared with standard conversion imports (Google, September 2026). Google Ads can also bid higher for new customers, or bid on nobody else, once a customer list and the Google tag show it who already buys (Google Ads Help).
Creative. Meta and TikTok now lean on the ad itself to find the audience, so a steady supply of new concepts usually reaches new buyers more cheaply than tighter targeting. Judge creative tests on new customer cost, not clicks.
Offer and order value. CAC is only one side of first-order recovery. Bundles, shipping thresholds and product mix raise first-order contribution, which can close the gap as well as a lower CAC.
Retention. Each extra repeat order raises 12-month contribution and the CAC you can afford. At the defaults, lifting repeat orders from 0.5 to 0.75 adds $9.00 and more than doubles 12-month profit.
Then check the top line: the marketing efficiency ratio shows whether total spend still pays as CAC moves, and NC-ROAS tracks the same new customer economics as a ratio.
Does A Higher Order Value Lower CAC? What One Fashion Brand’s Numbers Show
A heritage fashion brand we work with makes the order value lever visible at scale. Divide average order value by new-customer CPA and you get first-order revenue per dollar of new-customer acquisition cost. In Q1 2025 that was about 2.08 ($68.87 / 33.08).InQ12026itwasabout2.76(85.75 / $31.06), while blended ad spend rose from $368,198 to $1,912,212.
What the numbers do not prove: they are blended figures from the brand’s Triple Whale account across every paid channel, the AOV is store-wide and stands in for first-order value, nobody ran a holdout to separate what the ads caused from what would have happened anyway, and range and merchandising changes moved them alongside media.
The lesson sits in the two halves of the ratio. New-customer CPA edged down from $33.08 to $31.06 while spend grew roughly fivefold, and order value rose by about a quarter, so each acquired customer’s first order covered more of its own cost. Brands chasing a lower CAC usually get further by working order value at the same time.
For a second opinion on how your CAC is counted and where it should sit, whichever partner runs your ads, our free paid media audit reconciles store and platform numbers and returns a ranked list of fixes.
Common Questions
How do you figure customer acquisition cost for an online store?
Add up what you spent to acquire customers in a period and divide by first-time customers from the same dates. Ad spend alone gives paid CAC; adding fees, creative production and tools gives fully loaded CAC. Never divide by total orders, or repeat buyers make acquisition look cheaper.
What is a good LTV to CAC ratio for ecommerce?
The familiar 3:1 benchmark comes from SaaS and usually assumes revenue-based LTV. For a store, measure LTV as 12-month contribution instead. On that basis anything reliably above 1.0 within a payback period you can fund is workable, and a first order that recovers most of CAC makes the cohort far safer.
What is a CAC payback period?
It is how long a cohort of new customers takes to generate enough contribution to repay its acquisition cost. Add first-order and repeat-order contribution month by month until the total passes CAC. Stores usually need shorter payback than software companies, because repeat orders are not under contract.
Is CPA the same as CAC?
No. Platform CPA is cost per purchase as an ad platform reports it, so it counts repeat buyers and orders other channels also claim. CAC is the cost of one new customer, measured against your store’s first-time customer count. Triple Whale’s NC-CPA sits between them: blended spend divided by new customer orders.
Want CAC, payback and LTV to CAC calculated from your real order data rather than estimates? Book a free 30 minute growth audit and we will build the model with you.
Related Reading
- NC-ROAS: How to Calculate New Customer ROAS and Set a Floor: first-order economics as a single ratio
- Break-Even ROAS Calculator: Find the ROAS Your Margins Need: contribution margin, the input behind every target
- What Is a Good ROAS? 2026 Benchmarks and the Break-Even Test for Ecommerce: benchmarks set against your own break-even
- Ecommerce Attribution: Models, Tools and What to Trust: which source to trust for each CAC input