
The marketing efficiency ratio (MER) is total revenue divided by total marketing spend for the same period, so $400,000 of sales on $100,000 of spend is a marketing efficiency ratio of 4.0. It is healthy only when it clears your break-even MER: 1 divided by contribution margin before any marketing costs.
The marketing efficiency ratio became the number many ecommerce teams set budgets on because it ignores attribution: no platform gets to claim the sale. The catch is that one name now covers two inverse numbers. Shopify’s guide divides total revenue by total marketing spend (Shopify, July 2026), while Triple Whale divides blended ad spend by order revenue and puts the 2026 median for its customers at 39% (Triple Whale, October 2026). An MER of 39% and an MER of 2.56 describe the same store. Below: the marketing efficiency ratio formula in both forms, how to calculate marketing efficiency ratio from your own numbers, a break-even MER worked from margin, MER vs ROAS, what a good marketing efficiency ratio looks like, where it misleads and how to read it each week.
What Is The Marketing Efficiency Ratio, And What Goes In Each Line?
The marketing efficiency ratio formula is short: MER equals total revenue divided by total marketing spend, both taken from the same dates. The hard part is agreeing what each line holds, because the vendors that made the metric popular define it differently. Pinning that definition down is usually the first job of fractional CMO services, and the agreed number is what paid media management should be judged against each week.
On the revenue side, the choices are gross or net, and store only or every sales channel. Triple Whale uses order revenue, meaning what customers paid at checkout before refunds. Shopify leaves the choice open and asks only that a brand pick total sales or net sales and stick with it. For an apparel brand with heavy returns, the gap between the two can be wide enough to change a budget call, so we prefer net sales after discounts and returns, taken from the channels the marketing actually drives.
The spend line varies even more. Triple Whale counts ad spend and tells brands to keep salaries, agency fees and software out. Shopify lists paid ads, influencer fees, creative production, marketing tools and agency or contractor costs, with team salaries optional. The choice matters: reading FY25 annual reports, Eightx puts FIGS at an MER of 6.78 on marketing expense alone and 2.65 once selling expense is added (Eightx, May 2026).
Marketing Efficiency Ratio Formula: Revenue Over Spend, And The Inverse Form
The formula has an inverse form. Some teams, following Triple Whale, write the marketing efficiency ratio as spend divided by revenue, a percentage: “MER 25%” means marketing took a quarter of sales, the same as a ratio of 4.0. To convert, divide 1 by either figure. Neither form is wrong; mixing them in one report is, and so is changing the spend definition halfway through a year. Label the form on every dashboard, and fix the definitions in writing before anyone sets a target, which is where our tracking and attribution setup begins.
How To Calculate Marketing Efficiency Ratio: A Worked Example
To calculate marketing efficiency ratio, take the revenue and spend lines you fixed above and divide them for the same dates. A store with $600,000 of net sales on $150,000 of marketing spend has an MER of 4.0, or 25% in the inverse form. Run the calculation monthly for budget decisions and weekly as a guardrail, and write the definition at the top of the report so next quarter’s marketing efficiency ratio is comparable with this one.
MER vs ROAS: How Does The Marketing Efficiency Ratio Differ From Blended ROAS, Platform ROAS And NC-ROAS?
All four put revenue over spend. What separates them is which revenue and which spend. Blended ROAS is the marketing efficiency ratio with the denominator cut down to paid media, which is why Daasity’s guide lists blended ROAS as another name for the same metric (Daasity, May 2022). Platform ROAS is narrower again: the revenue Meta, Google or TikTok credits to its own ads under its own attribution window. NC-ROAS keeps store-wide ad spend underneath but counts only revenue from first-time buyers.
| Metric | Numerator | Denominator | Best use | Blind spot |
|---|---|---|---|---|
| MER | Total revenue, net or gross as defined | Every marketing cost you include: media, fees, creative, tools | Setting and policing the total marketing budget | Gives marketing credit for repeat, press and wholesale revenue |
| Blended ROAS | Total store revenue | Paid media spend only | Checking that ad spend as a whole pays for itself | Leaves out fees and creative, and shares MER’s repeat-revenue blind spot |
| Platform ROAS | Revenue one platform attributes to itself | Spend on that one platform | Comparing campaigns, ad sets and creatives inside an account | The same order can be claimed by several platforms at once |
| NC-ROAS (aMER) | Revenue from first-time customers | Paid media spend across every platform | Testing whether spend is adding customers | Says nothing about the repeat value a first order sets up |
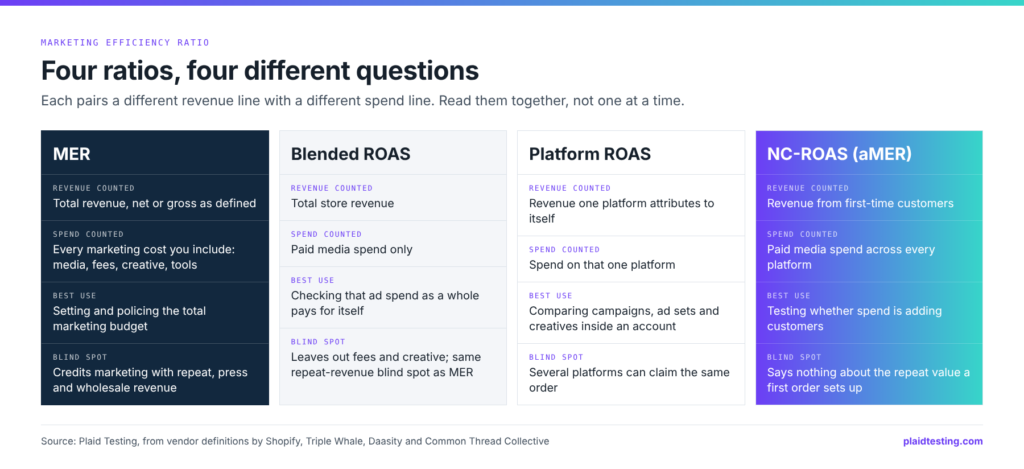
The new-customer version of the marketing efficiency ratio has its own label. Common Thread Collective defines acquisition MER, or aMER, as new customer revenue divided by total ad spend (Common Thread Collective, March 2022), and the analytics tool Klar divides net revenue from first orders by marketing costs (Klar, June 2026). When the denominator is paid media, aMER and NC-ROAS are one calculation under two names, so choose one and use it everywhere. Our NC-ROAS guide shows how to pull it from Shopify or Triple Whale, and our guide to measuring a paid social agency’s results on new customers applies the same test channel by channel.
MER and blended ROAS say whether the whole budget pays. NC-ROAS says whether it grows the customer base. Platform ROAS says which campaign deserves the next dollar inside one account, and those in-platform targets are best set from ROAS benchmarks checked against break-even.
How Do You Calculate A Break-Even Marketing Efficiency Ratio From Contribution Margin?
A break-even marketing efficiency ratio is the point at which marketing uses up all the contribution that sales left behind. Contribution margin before marketing is what remains of each sales dollar after product cost, shipping and fulfillment, payment processing, and returns and refunds. Divide 1 by that margin and you have the floor. A target marketing efficiency ratio adds the overhead and profit the business needs: 1 divided by contribution margin minus the share of revenue reserved for fixed costs and profit.
Take a $100 average order. Product cost is $35, shipping and fulfillment $10, payment fees $3 and returns and refunds $7, which leaves $45, a contribution margin of 45%. Break-even MER is 1 ÷ 0.45, or 2.22: marketing can absorb 45% of revenue before the business loses money on every order. Now reserve 12% of revenue for fixed costs such as salaries, rent and software, and aim for 8% profit. That leaves 25 points for marketing, so the target MER is 1 ÷ 0.25, or 4.0, which reads as “MER 25%” in the percentage form.
| Contribution margin before marketing | Break-even MER | Most marketing can take, share of revenue | MER that leaves 10% of revenue | MER that leaves 20% of revenue |
|---|---|---|---|---|
| 35% | 2.86 | 35% | 4.00 | 6.67 |
| 45% | 2.22 | 45% | 2.86 | 4.00 |
| 55% | 1.82 | 55% | 2.22 | 2.86 |
| 65% | 1.54 | 65% | 1.82 | 2.22 |
Two details catch people out. First, the margin must leave out exactly the costs that sit in the denominator: if agency fees and creative are counted as spend, they cannot also be buried inside contribution margin. Second, break-even moves during promotions, because a discount cuts revenue per order while most costs stay put. In the example, a 20% sitewide discount turns the $100 order into $80. Product and shipping costs stay at $45 while payment fees and refunds shrink to about $8, leaving roughly $27, a margin of about one third, and break-even MER climbs from 2.22 to about 2.96. The free calculator for break-even and target ROAS runs the same arithmetic for paid media on its own.
What Is A Good Marketing Efficiency Ratio For eCommerce?
A good marketing efficiency ratio is any figure above your break-even that also funds the overhead and profit you planned for. That is the honest answer, and it explains why published benchmarks disagree so widely: they measure different businesses with different denominators, and some are written in the inverse form.
| Source | What it measures | Figure as published | As revenue ÷ spend |
|---|---|---|---|
| Triple Whale, 2026 | Median across its customers, ad spend ÷ order revenue | 39% | About 2.56 |
| Triple Whale, last 90 days | Apparel median | 33.5% | About 2.99 |
| Triple Whale, last 90 days | Health and wellness median | 55.5% | About 1.80 |
| Eightx, FY25 annual reports | Median of nine public brands, marketing expense basis | 8.47 | 8.47 |
| Shopify, citing Eightx | Suggested healthy blended target | 3.0 to 5.0 | 3.0 to 5.0 |
| Funnel, 2024 | Ecommerce rule of thumb | 5.0 or above | 5.0 or above |
Read the spread before the numbers. Triple Whale’s figures are vendor data drawn from its own customers, on an ad-spend-only basis, with no sample size stated (Triple Whale, October 2026). Eightx’s median comes from nine public companies much larger than a typical private brand, several of them selling through retail. Funnel’s guide calls anything around 5.0 or above good for ecommerce (Funnel, July 2024), an older rule of thumb with no data behind it on the page.
For scale, total marketing budgets averaged 7.8% of company revenue in 2026 across the 401 marketing leaders Gartner surveyed for its annual CMO spend study (Gartner, May 2026), close to a marketing efficiency ratio of 12.8. Ecommerce brands that buy most of their customers through paid social and search run far below that, and should. Repeat rate is the other variable: a brand whose customers reorder often can accept a lower MER and still profit over a year, provided cohorts prove it. Our calculator that works out CAC and payback runs that math, and agreeing the reserve for overhead and profit with the founder is part of our fractional CMO service before any channel target is written.
When Does The Marketing Efficiency Ratio Mislead?
The marketing efficiency ratio’s strength is that it ignores attribution. Its weakness is the same thing: it hands marketing every dollar in the numerator, whatever caused it. Five situations distort it most often in the accounts we review.
- Returning customers. A loyal base lifts revenue whether or not the ads work. If repeat revenue grows faster than new-customer revenue, MER rises while acquisition stalls, so split revenue into new and returning every time MER is reported. Shopify’s own new-versus-returning report is the neutral source, as we cover in what a Shopify marketing agency should own.
- Promotions. Discounts pull revenue into a short window and shrink margin at the same moment. Adobe expects Cyber Week, Thanksgiving through Cyber Monday, to bring in $47.5 billion online, 17.3% of the 2026 holiday season, with apparel discounts peaking at 23% (Adobe, September 2026). A record Cyber Week MER can still sit below that week’s break-even.
- Organic and brand demand. Press, creators, word of mouth and retail presence send searches and direct visits that no ad paid for. MER books all of it to marketing, so a brand can cut useful prospecting and watch MER hold for a while.
- Seasonality and timing. Prospecting spend in October often converts in November. A weekly MER punishes the build-up and flatters the payoff, so compare against the same weeks last year and make budget decisions on monthly figures.
- Revenue the spend did not drive. Amazon, wholesale and retail sales in the numerator inflate MER without the ad budget touching them. Leave them out, or report a store-only MER beside the total.
When MER and the platform reports disagree, our guide to ecommerce attribution covers which source to trust for which decision.
How Should You Read The Marketing Efficiency Ratio Week To Week Alongside NC-ROAS?
We treat the marketing efficiency ratio as the guardrail for the whole budget and NC-ROAS as the test of growth, with contribution margin after marketing as the monthly check that both are telling the truth. Each week, read how the two moved together; the pairing says more than either number alone.
| Pattern this week | Likely reading | First thing to check |
|---|---|---|
| MER up, NC-ROAS up | Spend is adding customers efficiently | Room to scale; test the next budget step |
| MER up, NC-ROAS flat or down | Repeat buyers, a promotion or organic demand are carrying revenue | Split of spend between prospecting and retention; the email and promotion calendar |
| MER down, NC-ROAS holding | Returning revenue softened, or spend ran ahead of a season | Repeat purchase rate and cohort timing before cutting ads |
| MER down, NC-ROAS down | Acquisition is getting less efficient | Creative fatigue, offer and frequency; trim the weakest spend first |
| MER down, platform ROAS steady | Platforms are claiming sales the store does not see | Platform revenue against store orders; recent tracking changes |
For the next budget increase, average MER is the wrong tool because it blends the best dollars with the last ones. Marginal ROAS tells you what the extra spend actually returned.
The first row is what a heritage fashion brand we work with saw as it scaled. Its marketing efficiency ratio, sales divided by blended ad spend, rose from about 2.86 in the first quarter of 2025 ($1,053,536 on $368,198) to about 3.76 in the first quarter of 2026 ($7,199,241 on $1,912,212), per its Triple Whale account, while ad spend grew roughly five times. Net margin moved from 32.79% to 48.31% across the same quarters. These are store-wide numbers pooled across every paid channel, nobody ran a holdout to measure what the ads alone caused, and new products, pricing and merchandising changed during the same year.
The reading still holds. MER rising while spend scales is the signal to keep scaling. MER falling while platform ROAS holds steady is the signal to check what the platforms are claiming, so test any platform’s claimed ROAS against new-customer growth in the store before relying on it. Who owns that cross-channel call matters too: see what a media buying agency should handle.
Common Questions
How do you calculate marketing efficiency ratio?
Divide total revenue by total marketing spend for the same period: $600,000 of net sales on $150,000 of marketing spend is an MER of 4.0. Decide first whether spend means paid media only or also fees, creative and tools, and whether revenue is gross or net, then keep both definitions fixed.
What is a good marketing efficiency ratio for an ecommerce brand?
A good ratio is one above your break-even MER (1 ÷ contribution margin before marketing), with room left over for overhead and profit. At a 45% margin, break-even is 2.22. Published medians vary widely: Triple Whale’s 2026 customer median is 39% of revenue, about 2.56, so treat any benchmark as context, not a target.
Is the marketing efficiency ratio the same as blended ROAS?
Often, yes. When the spend line holds only paid media, MER and blended ROAS are the same calculation, and some vendors use the names interchangeably. MER becomes the broader measure when the spend line also carries agency fees, creative production, influencer costs and marketing tools.
Why is my marketing efficiency ratio shown as a percentage?
Some tools, including Triple Whale, write MER as ad spend divided by revenue, so lower is better: 25% means marketing took a quarter of sales. The ratio form divides revenue by spend, so higher is better. Divide 1 by either figure to convert between them: 25% equals 4.0.
What is the difference between MER and ROAS?
MER vs ROAS is a question of scope. The marketing efficiency ratio divides total revenue by total marketing spend, while platform ROAS divides the revenue one ad platform credits to itself by that platform’s spend. Blended ROAS sits between them, and NC-ROAS counts only first-time customer revenue.
Want your MER, break-even MER and target MER worked out from your own P&L rather than a benchmark? Book a free 30 minute growth audit and we will rebuild the number from your contribution margin and spend.
Related Reading
- Marginal ROAS: How to Tell When the Next Dollar Stops Paying: for when a healthy MER hides spend that no longer pays
- NC-ROAS: How to Calculate New Customer ROAS and Set a Floor: a new-customer check to run beside MER
- What Is a Good ROAS? 2026 Benchmarks and the Break-Even Test for Ecommerce: per-channel targets built from the same margin math
- Break-Even ROAS Calculator: Find the ROAS Your Margins Need: how each order cost feeds the margin you divide by
- Ecommerce Attribution: Models, Tools and What to Trust: settling disagreements between store and platform revenue