
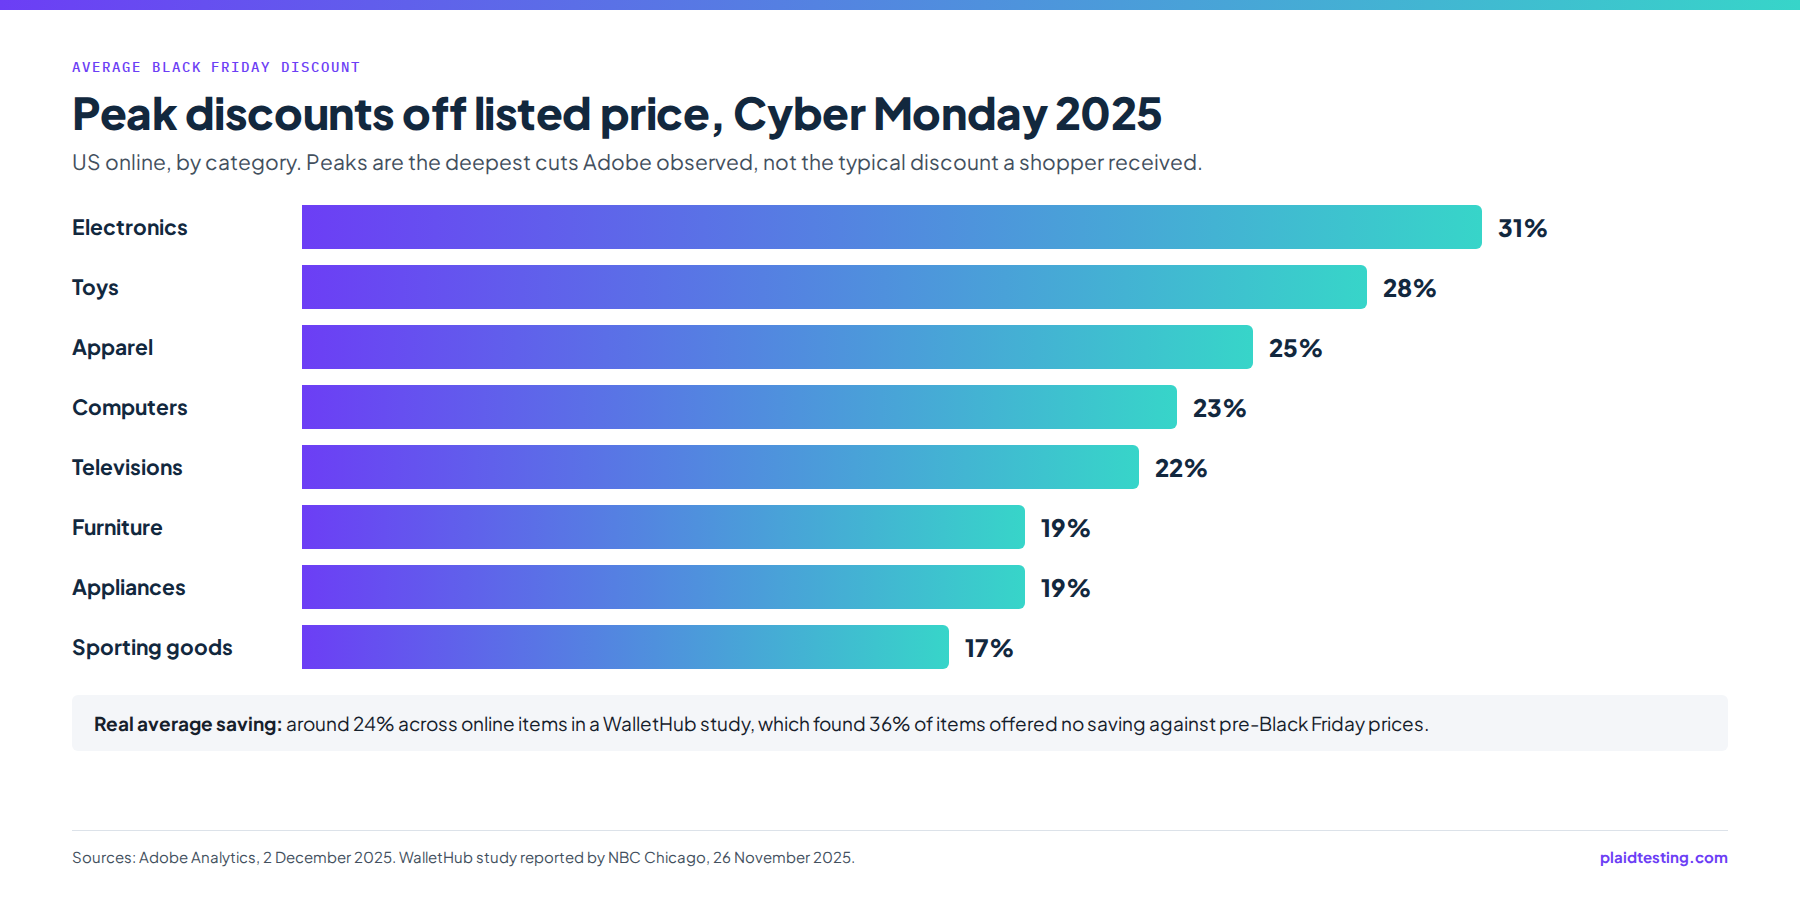
The average Black Friday discount in 2025 depended on the category: peak discounts ran from 17% to 31% off listed price (Adobe, 2 December 2025), and a WalletHub study put the average real online discount at about 24% (NBC Chicago, 26 November 2025). How deep you can go depends on your margin and ad costs.
Those figures describe what shoppers were offered. A merchant deciding how much discount for Black Friday to run is asking something different: how deep can the discount go before the extra orders stop paying for the margin given away and for the ads that brought them in? The answer changes by product, and it is simple enough to work out for your top sellers in an afternoon.
What is the average Black Friday discount?
Adobe reported the 2025 peak discounts off listed price by category in its Cyber Monday release: electronics 31%, toys 28%, apparel 25%, computers 23%, televisions 22%, furniture 19%, appliances 19% and sporting goods 17% (Adobe, 2 December 2025). Its review of the full season, 1 November to 31 December, put the peaks at 30.9% for electronics and 29.6% for toys (Adobe, 7 January 2026). The two releases are close, with toys peaking slightly deeper across the season than in the Cyber Monday figures.
| Category | Peak discount off listed price, Cyber Monday 2025 release | Season peak, November to December 2025 | Source |
|---|---|---|---|
| Electronics | 31% | 30.9% | Adobe, 2 December 2025; Adobe, 7 January 2026 |
| Toys | 28% | 29.6% | Adobe, 2 December 2025; Adobe, 7 January 2026 |
| Apparel | 25% | Not in our source | Adobe, 2 December 2025 |
| Computers | 23% | Not in our source | Adobe, 2 December 2025 |
| Televisions | 22% | Not in our source | Adobe, 2 December 2025 |
| Furniture | 19% | Not in our source | Adobe, 2 December 2025 |
| Appliances | 19% | Not in our source | Adobe, 2 December 2025 |
| Sporting goods | 17% | Not in our source | Adobe, 2 December 2025 |
| All online items in the WalletHub study | Average real discount around 24%; 36% of items offered no savings against pre-Black Friday prices | Not applicable | WalletHub, reported by NBC Chicago, 26 November 2025 |
Read those numbers with two cautions. First, Adobe’s figures are peaks: the deepest cut observed in each category, not the discount a typical shopper received on a typical day. Second, “off listed price” assumes the listed price was genuine. A WalletHub study, reported by NBC Chicago on 26 November 2025, found no savings at all on 36% of the online items in the study, measured against their prices before Black Friday, and an average real discount of around 24% (NBC Chicago, 26 November 2025).
So the fair answer to the Black Friday discount percentage question is roughly a quarter off in real terms, with category peaks between 17% and 31%. Electronics and toys discount hardest, apparel sits near the middle at 25%, and furniture, appliances and sporting goods run shallower.
Spending still grew. In the same release, Adobe counted $14.25 billion in US online sales on Cyber Monday 2025, up 7.1%, with Black Friday at $11.8 billion, up 9.1% (Adobe, 2 December 2025). Neither total shows how much of that spending the discounts caused, which is one reason the category average is a weak guide to your own offer.
Why is the category average the wrong benchmark for your brand?
A category peak tells you what the most aggressive sellers in that category did at one moment. It says nothing about their costs, or about yours. Four gaps separate that benchmark from a decision you can actually make.
Your margin is not the category’s. A 25% discount on a product with a wide gross margin and a 25% discount on a product with a thin one are different decisions. The first may still leave room for ad spend. The second may lose money on every paid order. The worked example in the next section shows how quickly that happens.
Growth in 2025 leaned on price more than volume. Salesforce reported that Cyber Week online sales reached $336.6 billion globally, up 7%, while average selling price rose 6% and order volume rose 2% globally and 1% in the US (Salesforce, 5 December 2025). More of the growth came from what each item sold for than from extra orders. That pattern does not suggest a wave of additional buyers drawn in by deeper cuts.
Returns come off the top. NRF and Happy Returns reported that retailers expected 17% of holiday sales to be returned, and that 19.3% of online sales across 2025 were expected to come back (NRF, 15 October 2025). A discount benchmark ignores that entirely, and a returned sale order has already spent the ad money that won it.
Ad prices were rising. Meta’s average price per ad rose 6% year over year in the fourth quarter of 2025, the quarter that holds Black Friday, with ad impressions up 18% (Meta, 28 January 2026). When ads cost more to run, less margin is left over for the discount to give away.
The benchmark that matters is your own break-even point, product by product. It takes three inputs to find.
If you would like a second pair of eyes on the numbers behind your Black Friday offer, bring them to a free 30 minute growth audit while there is still time to change the plan.
How do you calculate the deepest discount you can afford?
Work product by product, or by margin tier if your range is large. You need three inputs: the list price, the product cost, and the fulfillment and payment costs of one order. The example below uses a hypothetical product, not client data, with a $100 list price, a $30 product cost and $12 of fulfillment and payment costs per order.
Three formulas do the work:
- Contribution before ad spend = sale price minus product cost minus fulfillment and payment costs. At full price that is $100 minus $30 minus $12, or $58.
- Break-even ROAS = sale price divided by contribution. At full price, $100 divided by $58 gives 1.72x. At that ROAS the ad spend per order equals the contribution per order, so each order earns nothing; below it, each order loses money.
- Orders needed to match full-price contribution = $58 divided by the contribution at the sale price. At 20% off, $58 divided by $38 gives 1.53x: you need 1.53 orders for every order you would have taken at full price.
Illustrative example, hypothetical product (not client data): $100 list price, $30 product cost, $12 fulfillment and payment costs per order.
| Discount | Sale price | Contribution before ad spend | Break-even ROAS | Orders needed to match full-price contribution |
|---|---|---|---|---|
| 0% | $100 | $58 | 1.72x | 1.00x |
| 10% | $90 | $48 | 1.88x | 1.21x |
| 20% | $80 | $38 | 2.11x | 1.53x |
| 30% | $70 | $28 | 2.50x | 2.07x |
| 40% | $60 | $18 | 3.33x | 3.22x |
Three things stand out. Contribution falls much faster than price: a 40% price cut leaves $18 of the original $58, less than a third. Break-even ROAS nearly doubles, from 1.72x at full price to 3.33x at 40% off, so an ad account that is comfortably profitable in October can lose money on every paid order in November. And the volume needed to stand still climbs steeply, to 2.07 times the orders at 30% off and 3.22 times at 40% off, before any extra ad spend.
To find your ceiling, compare the break-even column with the ROAS your account can realistically hold during the sale, judged from your own results in past peaks. The deepest affordable discount is the last row where your expected ROAS sits clearly above break-even and where the orders-needed multiple is something your past sales show you can reach. If you have no evidence that a product can more than triple its order count at 40% off, the calculation says not to offer 40%.
Two refinements make the numbers more honest. Payment fees are usually a percentage of the order, so in practice that cost falls slightly as the price falls; the table holds it flat to keep the arithmetic readable. Returns push the other way. A returned order gives back the sale price, but the ad spend and most of the fulfillment cost are already gone, so run the calculation again with your own return rate by product before you settle on a depth.
Which offers move volume without the deepest discount?
A straight percentage off is often the most expensive way to run a sale, because it gives the same cut to every order, including orders that would have happened at full price. The structures below aim the discount at the behavior you want, and they are the Black Friday sale ideas we test first.
| Offer structure | What pays for it | What to watch |
|---|---|---|
| Tiered spend (spend more, save more) | Larger baskets, since the deeper tier only applies above a threshold | Tiers set below your usual order value give margin away |
| Bundle or set | More items per order sharing one shipment | Bundles padded with slow sellers nobody asked for |
| Gift with purchase | The product cost of the gift, not a share of the whole price | Gifts that cost more to pick and ship than they add in appeal |
| Free shipping threshold | Bigger orders absorb the delivery cost | A threshold so far above your average order that few shoppers reach it |
| Early access for customers or subscribers | Timing and loyalty instead of depth | Early access that only starts the same discount sooner |
| Targeted depth | Deeper cuts limited to overstock or high-margin lines | Sitewide messaging that promises more than the offer gives |
Some of these have public data behind them. Among US shoppers who abandoned a cart for a reason other than just browsing, 40% said extra costs were too high, twice the 20% who blamed slow delivery (Baymard Institute, updated 22 September 2025). That supports a free shipping threshold as an alternative to a deeper product discount. For setting the threshold, Shopify reported an average cart of $114.70 across its merchants’ global BFCM 2025 sales (Shopify, 2 December 2025). Treat that as context rather than a target, and set yours a step above your own average order value so the offer lifts basket size.
Early access has timing on its side. NRF found that 84% of shoppers over the 2025 Thanksgiving weekend had started their holiday shopping before it, yet still had 53% of that shopping ahead of them (NRF, 2 December 2025). People who start early are a reason to give existing customers first access instead of a bigger percentage.
An athletic apparel brand we work with grew units sold 63.8% in the first six months of 2026 compared with the same six months of 2025, per its Triple Whale account. We mention it because volume has more levers than discount depth: product, merchandising, retention and offer structure all move it. It is a half-year figure, not a Black Friday one, and it is not evidence about any particular discount level or offer structure.
If you want ad lines written for each of these structures, we set out examples by offer type in Black Friday Ad Copy: 30 Examples by Offer Type.
What rules does a Black Friday discount have to follow?
A discount claim has to be true. For a US online seller, two sets of rules come up first: the Federal Trade Commission’s pricing guides and, if you advertise on Google, Merchant Center policy. What follows is a summary, not legal advice.
The former price must be real. Under the FTC Guides Against Deceptive Pricing, a comparison with a former price holds up only when that price was bona fide: the one the item was actually and openly offered at, routinely, over a reasonably substantial stretch of time (FTC, 16 CFR 233.1). Set a fictitious, inflated former price and the guides treat the bargain as false. The WalletHub finding that more than a third of online items offered no real savings is a reminder that a sale label and a real saving are not the same thing.
Google checks prices and price history. In Merchant Center the sale price has to sit below the regular price, and shoppers should see both prices on the landing page but only the sale price once they reach checkout (Google Merchant Center Help). The sale price annotation only appears for a discount above 5% and below 90%. Google also looks back at price history: for US Shopping ads, the base price has to have been charged on 5 days in the last 30, or on 15 days in the last 200 (Google Merchant Center Help). The sale_price_effective_date attribute controls how long a sale price shows. Leave out a time and the sale runs from 12 AM on the first day to 11:59 PM on the last; leave out a timezone and Google assumes UTC (Google Merchant Center Help), so set the timezone or a US sale can start and end hours early.
Promotions have floors and limits. In the US, a Merchant Center promotion has to be worth at least 5% or $5 off, can run for no more than 6 months (183 days), and cannot ask shoppers to buy a paid membership to redeem it (Google Merchant Center Help).
The two standards measure different things. Google’s history check is a mechanical minimum, while the FTC standard asks whether the former price was bona fide over a reasonably substantial period. A price raised for a week in early November might clear Google’s 5-day check and still fail the FTC test, so plan regular prices as carefully as sale prices. Whoever runs your paid media and product feed should own the Google side of this before the offer goes live.
How should you set your 2026 discount?
In 2026 the sale weekend runs from Thanksgiving on Thursday 26 November through Black Friday on 27 November to Cyber Monday on 30 November. The forecasts point to growth, but modest growth overall. Deloitte expects holiday retail sales from November 2026 to January 2027 of $1.70 trillion to $1.71 trillion, up 4.0% to 4.8%, with ecommerce at $316.1 billion to $318.9 billion, up 7.5% to 8.4% (Deloitte, 10 September 2026). In PwC’s survey of 4,093 US consumers in June 2026, people expected to spend $708 on gifts on average, down 2%; 79% said deals and discounts influence when they shop; and about 40% of planned gift spending lands in the 5 days between Thanksgiving and Cyber Monday (PwC, 8 September 2026).
Note the wording in that PwC finding: deals influence when people shop. That is an argument for having a clear offer live in the window, not for having the deepest one. With that in mind, this is how we set the discount:
- Calculate break-even ROAS for your top products or margin tiers with real costs, using the formulas above.
- Sort the range. Protect best sellers with a light offer or none, promote core lines at a depth the math supports, and clear overstock deeper.
- Choose the offer structure before the depth. A threshold, bundle or gift may do the job a bigger percentage would.
- Check every “was” price against the FTC standard and every feed sale price against Google’s rules, with timezones set.
- Lock offers, pricing and promotions by Friday 30 October, the deadline in our Black Friday checklist for ecommerce brands, so ads, emails and feeds are built on final numbers.
- Judge sale-day budgets against the sale’s break-even ROAS, not October’s, and let budgets rather than bid targets do the moving during the sale window. Our BFCM 2026 paid media calendar covers the timing.
- After the sale, judge the offer on contribution after ad spend and returns, read from numbers that cannot double count, as explained in our guide to ecommerce attribution models and tools.
Discount depth is a pricing decision with margin, inventory and media consequences, which is why we treat it as a strategy call that sits above the ad account rather than inside it. In the brands where we hold the fractional CMO seat, the offer comes out of the margin math first and the media plan follows it.
Planning a Black Friday offer for a brand spending $50,000 or more a month on ads? Book a free 30 minute growth audit before offers lock on 30 October, and bring break-even numbers for your top products so the conversation starts from your margins.
Common questions
What is a good discount for Black Friday?
A good discount is one your break-even ROAS can carry. For the hypothetical product above, 20% off needs 2.11x ROAS and 1.53 times the orders, while 40% off needs 3.33x and 3.22 times. As a market reference, WalletHub put the average real online discount near 24%, and Adobe’s category peaks ranged from 17% to 31%. Start from your margin, then see where you sit against those.
Is 50% off too much?
Unless your margins are unusually wide, usually yes. On the same hypothetical product, 50% off gives a $50 sale price and $8 of contribution ($50 minus $30 minus $12). Break-even ROAS becomes 6.25x ($50 divided by $8), and you would need 7.25 times the orders ($58 divided by $8) to match full-price contribution. It can make sense for clearing stock you would otherwise write off, not as a sitewide offer.
Should I discount sitewide or only some products?
Selective discounts are easier to afford. A sitewide offer hands the same cut to products that would have sold at full price anyway, best sellers included. A targeted offer lets you go deeper where margin or excess stock allows and hold price where demand is strong. Sitewide can still make sense when margins are even across the range and a simple message helps the ads.
Do deeper discounts lead to more returns?
We have not found verified public data that links discount depth to return rates directly, so treat any claim that it does as unproven. What is documented is the scale: retailers expected 17% of holiday sales to come back, according to NRF and Happy Returns. Tag orders by offer, then compare return rates by offer in your own data after the sale.
Related reading
- BFCM 2026 Paid Media Calendar for Ecommerce Brands: when spend should move around your offer dates
- Meta Ads for Black Friday: Structure and Budget Pacing: pacing Meta once your break-even ROAS is known
- BFCM Creative Testing: What to Test in October: testing offer framing before the sale starts
- What Does a Fractional CMO Actually Do? Scope and 90 Days: where pricing and offer decisions sit
- Cyber Monday Marketing Ideas That Protect Margin: offer structures and channel plays for the Monday after Black Friday that do not rely on deeper discounts